
Image source: © 2025 Krish Capital Pty.Ltd
Highlights
- Revenue up 2.7% on 7% higher freight volumes across network.
- Net income rose 36.7% to CAD 1,234M with equity investment gain.
- Operating ratio improved to 63.7%; cash flow increased 6% YoY.
Canadian Pacific Kansas City Limited (TSX: CP) is a CAD 8 billion Class I railroad with a 12,500-mile network across Canada and the US Midwest and Northeast. Its freight mix is diversified, led by grain and intermodal (22% each), energy and chemicals (20%), coal (8%), potash (10%), automotive (5%), and other merchandise.
For the second quarter of 2025, the company recorded total revenues of CAD 3,699.0 million, compared to CAD 3,603.0 million in the prior corresponding period (pcp), an increase of 2.7%. The change was mainly attributed to a 7% rise in freight volumes across the North American network. Operating income for the quarter was CAD 1,343.0 million, up from CAD 1,267.0 million in pcp, supported by lower fuel costs and an improved operating ratio.
Net income was CAD 1,234.0 million in Q2 2025, compared to CAD 903.0 million in Q2 2024, reflecting an increase of 36.7%. The result included contributions from operating performance and a gain on the sale of an equity investment. Net cash provided by operating activities was CAD 1,355.0 million, compared to CAD 1,278.0 million in the prior-year period, primarily due to higher earnings and disciplined working capital management.
In addition, the company’s operating ratio for the period was 63.7%, an improvement of 110 basis points from the prior year. Its core adjusted operating ratio also decreased to 60.7%. These figures reflect operating efficiencies achieved despite cost pressures from compensation and equipment rentals. Operating cash flow stood at CAD 1.36 billion in the second quarter of 2025, up from CAD 1.28 billion in the prior year, supporting capital spending and debt repayments.
Stock Information
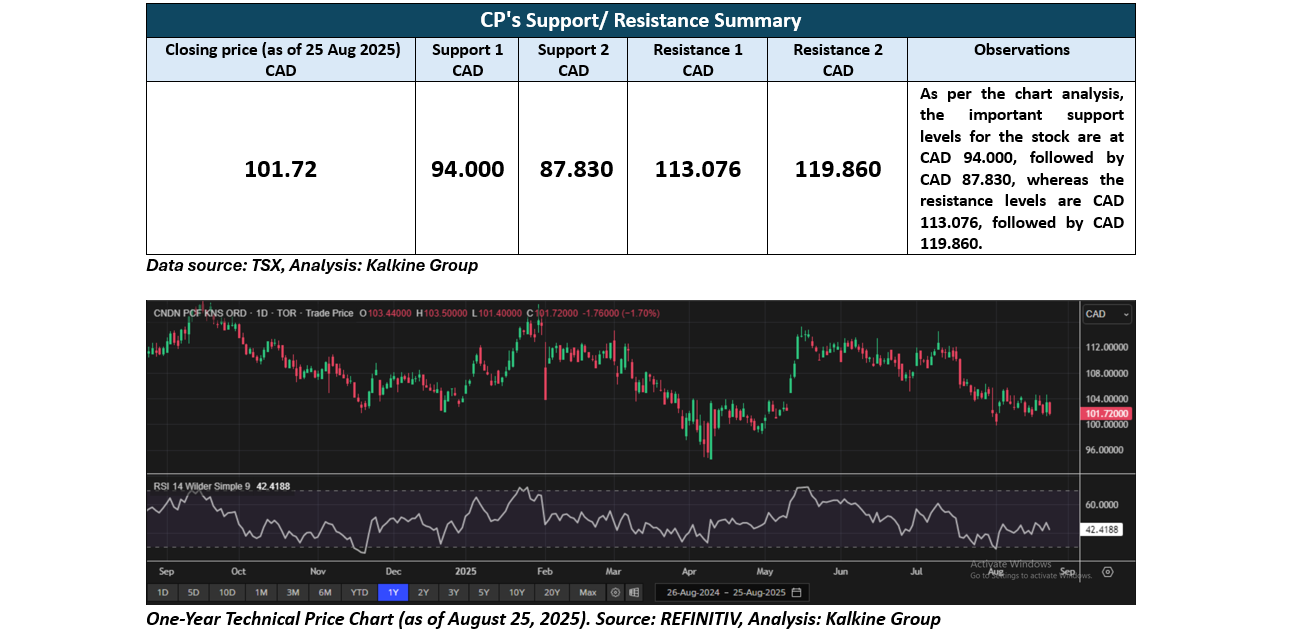
Shares of CP closed at CAD 101.72 on Aug 25, 2025. Over the past month, the stock has declined 3.51%, and over the last three months, it is down 8.82%. Its six-month performance shows a 6.54% drop, while the one-year return stands at -8.23%. The stock reached a 52-week high of CAD 119.20 on September 17, 2024, and a 52-week low of CAD 94.60 on April 9, 2025, currently trading 14.66% below its 52-week high.
Note 1: Past performance is not a reliable indicator of future performance.
Note 2: The reference data for all price data, currency, technical indicators, support, and resistance levels Is 25 August 2025. The reference data in this report has been partly sourced from EODHD/Others.
Technical Indicators Defined
Support: A level at which the stock prices tend to find support if they are falling, and a downtrend may take a pause backed by demand or buying interest. Support 1 refers to the nearby support level for the stock and if the price breaches the level, then Support 2 may act as the crucial support level for the stock.
Resistance: A level at which the stock prices tend to find resistance when they are rising, and an uptrend may take a pause due to profit booking or selling interest. Resistance 1 refers to the nearby resistance level for the stock and if the price surpasses the level, then Resistance 2 may act as the crucial resistance level for the stock.


 Please wait processing your request...