
Highlights
- DBM’s Q1 revenue surged by 31.7% YoY, primarily driven by the strategic acquisitions of Doman-Tucker Lumber and Southeast Forest Products.
- The company recorded net earnings of CAD 23.6 due to an increase in EBITDA by 56.3% YoY.
- DBM declared a dividend of CAD 0.14 per share for the 60th consecutive quarter, paid on April 15, 2025
Doman Building Materials Group Ltd (TSX: DBM) is a wholesale distributor of building and home renovation materials, serving residential, industrial, and retail markets. The company also manages timberlands and operates in post-peeling and pressure treating through CanWel Fibre Corp.
In the first quarter of the financial year 2025 (Q1FY25), the company’s sales increased by 31.7% YoY to CAD 793.2 million, primarily driven by the strategic acquisitions of Doman-Tucker Lumber and Southeast Forest Products. The company’s expenses surged by 20.3% YoY to CAD 87.0 million, largely due to higher distribution, selling, and administration costs, as well as increased depreciation and amortisation. Net earnings rose 63.9% YoY to CAD 23.6 million, driven by higher operating income from top-line growth and a 56.3% YoY increase in EBITDA.
Recent Business Update
On September 17, 2024, DBM completed the early repurchase and cancellation of CAD 52.3 million of its outstanding 2026 unsecured notes to optimize its capital structure and reduce near-term debt obligations. The company declared a dividend of CAD 0.14 per share for the 60th consecutive quarter, which was paid on April 15, 2025, to shareholders of record as of March 31, 2025.
Company Outlook
In FY2025, the company is facing price volatility in construction materials due to inflation, interest rates, trade tensions, and supply chain challenges. Canadian housing starts, a key demand driver for DBM, declined to 235,644 in Q1FY25, reflecting early signs of a cooling housing market.
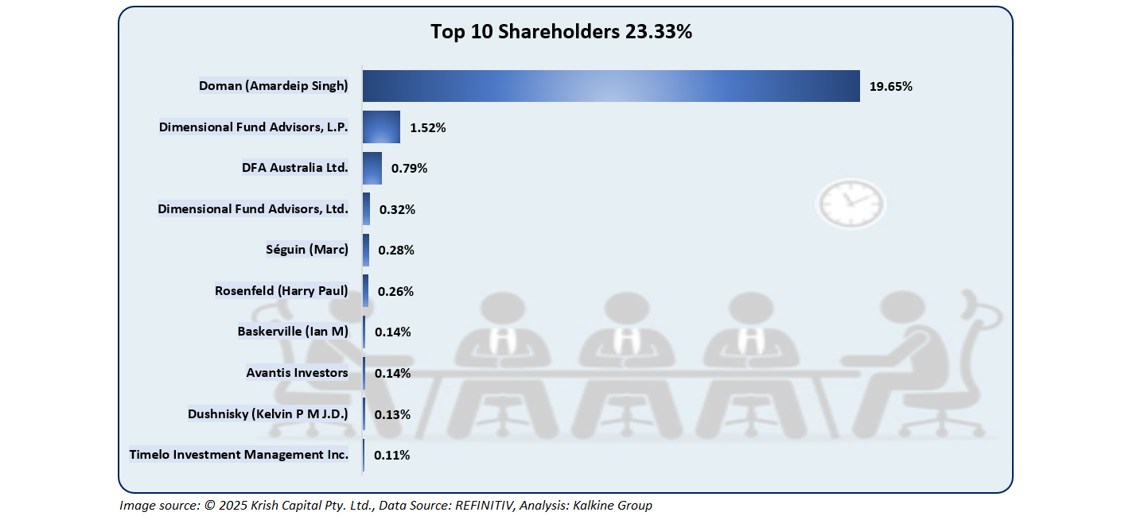
Top 10 Shareholders
The top 10 shareholders together form ~23.33% of the total shareholding in the company. Doman (Amardeip Singh) and Dimensional Fund Advisors, L.P. hold a maximum stake in the company at ~19.65% and ~1.52%, respectively.
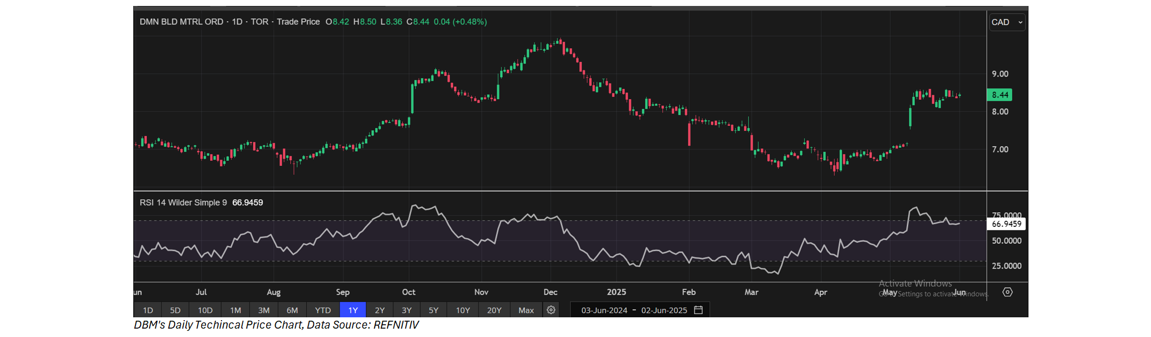
Stock Information
The stock has gained approximately 1.44% over the past week and around 20.91% over the last three months. As of June 2, 2025, it is trading above its 52-week average high of CAD 9.95 and its 52-week low of CAD 6.30, closing at CAD 8.44.
Note 1: Past performance is not a reliable indicator of future performance.
Note 2: The reference data for all price data, currency, technical indicators, support, and resistance levels is June 02, 2025. The reference data in this report has been partly sourced from EODHD/Others.
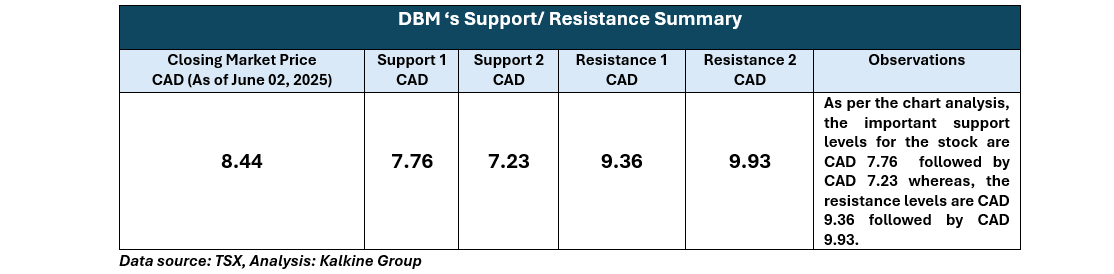
Technical Indicators Defined
Support: A level at which the stock prices tend to find support if they are falling, and a downtrend may take a pause backed by demand or buying interest. Support 1 refers to the nearby support level for the stock and if the price breaches the level, then Support 2 may act as the crucial support level for the stock.
Resistance: A level at which the stock prices tend to find resistance when they are rising, and an uptrend may take a pause due to profit booking or selling interest. Resistance 1 refers to the nearby resistance level for the stock and if the price surpasses the level, then Resistance 2 may act as the crucial resistance level for the stock.


 Please wait processing your request...