Highlights
- Dynacor has lifted Q3 2025 sales to USD 100.5 million on higher realized gold prices.
- The company recorded a year-over-year margin increase despite one-time reorganization costs.
- The company reported lower quarterly net income as higher G&A and non-recurring costs weigh on results.
- The company expanded investment spending, driven by the Ecuador Svetlana plant acquisition and increased capex.
Dynacor Group Inc. (TSX:DNG) is a Canada-based, dividend-paying industrial gold ore processor. The company produces gold by processing ore sourced from the artisanal and small-scale mining (ASM) sector.
In the third quarter of 2025 (Q3 2025), the company reported higher sales as increased realized gold prices lifted revenue, while earnings and cash flows reflected the effect of non-recurring costs and expanded investment spending.
Sales were USD 100.5 million in Q3 2025 versus USD 76.2 million in Q3 2024, a 31.9% year-over-year increase, driven by higher realized prices and partly offset by lower gold ounces sold. Gross operating margin was USD 11.7 million compared with USD 10.3 million a year earlier, up 13.3% year over year, with one-time reorganization costs affecting margins.
Net income and comprehensive income were USD 5.4 million in Q3 2025 against USD 5.8 million in Q3 2024, a 6.9% decline due to higher G&A expenses and non-recurring items. Net cash from (used in) investing activities was negative USD 10.2 million in Q3 2025 compared with negative USD 1.3 million a year earlier, a 672.5% change, mainly linked to the Ecuador Svetlana plant acquisition and higher capex.
Recent Business Update
Dynacor declared its December 2025 monthly dividend of CAD 0.01333 per share, marking its 69th dividend and 59th consecutive monthly payment.
Company Outlook
Dynacor enters Q4-2025 and 2026 with decent momentum backed by record sales, margin tailwinds from elevated gold prices, and a clear multi-country expansion roadmap. Production and earnings guidance appear well supported as ore supply stabilizes and project execution advances across Peru, Ecuador and Senegal. With first ore expected from Senegal in Q1-2026 and Ecuador ramp-up from late 2026, the company is positioned for a multi-year growth slope. Cash generation should remain healthy, enabling continued dividends and buybacks while funding development initiatives.
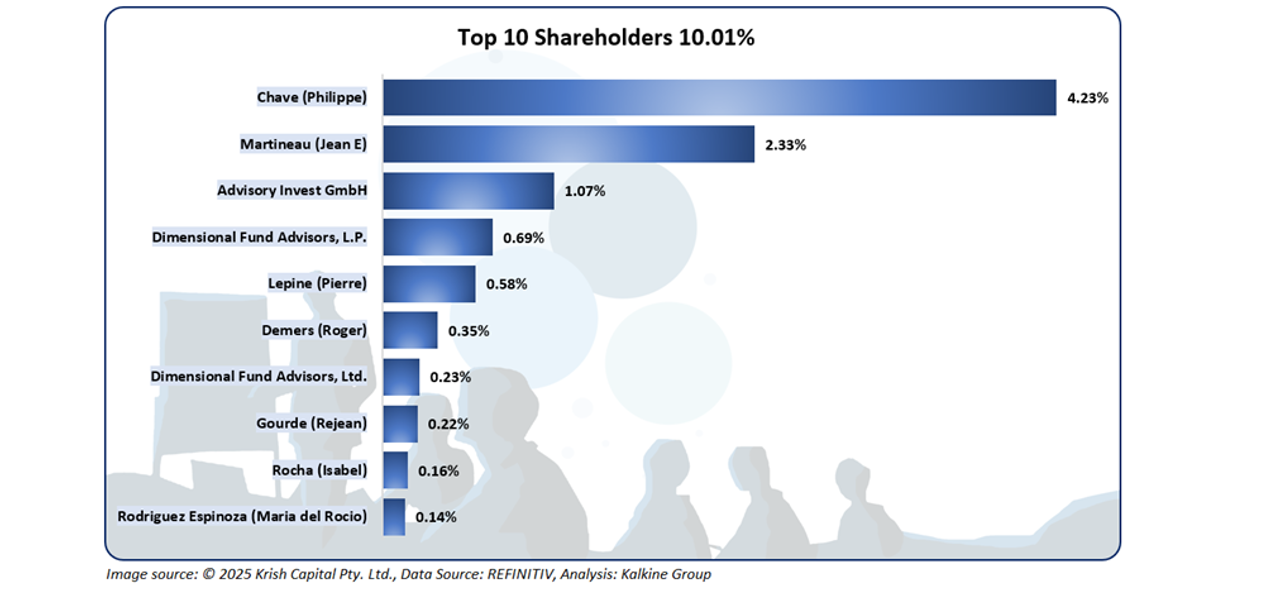
Top Shareholders
The top 10 shareholders collectively account for around 10.01% of the company’s equity. Philippe Chave and Jean E. Martineau hold the largest individual stakes at about 4.23% and 2.33%, respectively.
Stock Information
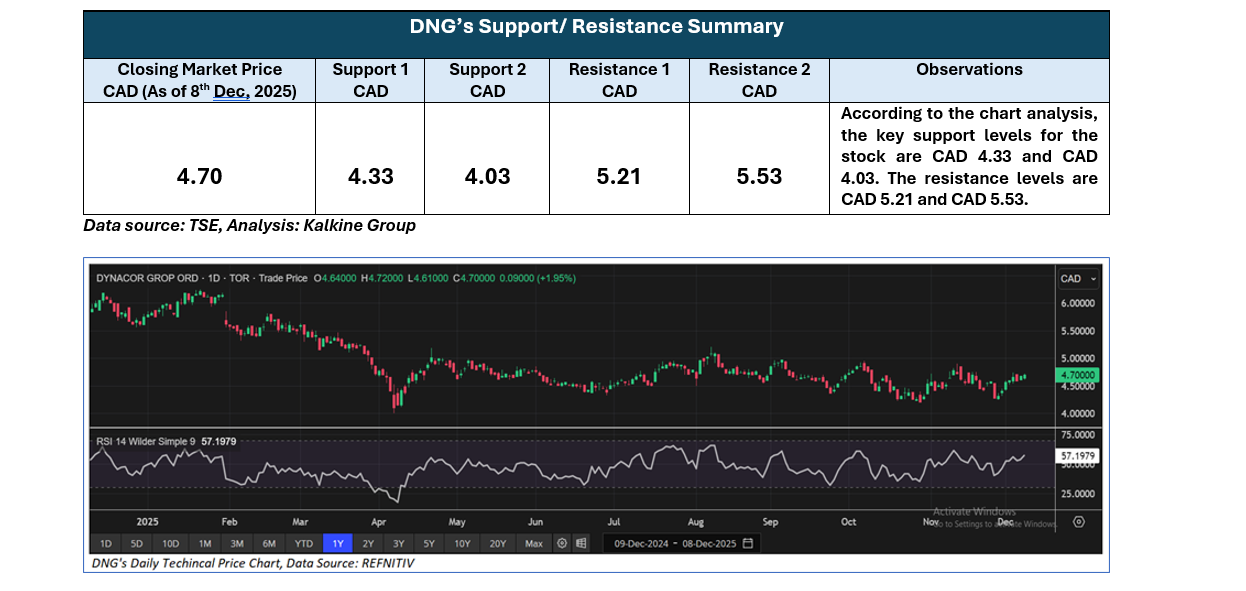
The stock has recorded an approximate 2.84% gain over the past week and an estimated 2.28% decline over the last three months. It currently trades below its 52-week high of CAD 6.25 and above its 52-week low of CAD 4.00.
 Note 1: Past performance is not a reliable indicator of future performance.
Note 2: The reference date for all price data, currency, technical indicators, support, and resistance levels is December 08, 2025. The reference data in this report has been partly sourced from EODHD/Others.
Technical Indicators Defined: -
Support: A level at which the stock prices tend to find support if they are falling, and a downtrend may take a pause backed by demand or buying interest. Support 1 refers to the nearby support level for the stock and if the price breaches the level, then Support 2 may act as the crucial support level for the stock.
Resistance: A level at which the stock prices tend to find resistance when they are rising, and an uptrend may take a pause due to profit booking or selling interest. Resistance 1 refers to the nearby resistance level for the stock and if the price surpasses the level, then Resistance 2 may act as the crucial resistance level for the stock.


 Please wait processing your request...