
Image source: shutterstock
Highlights
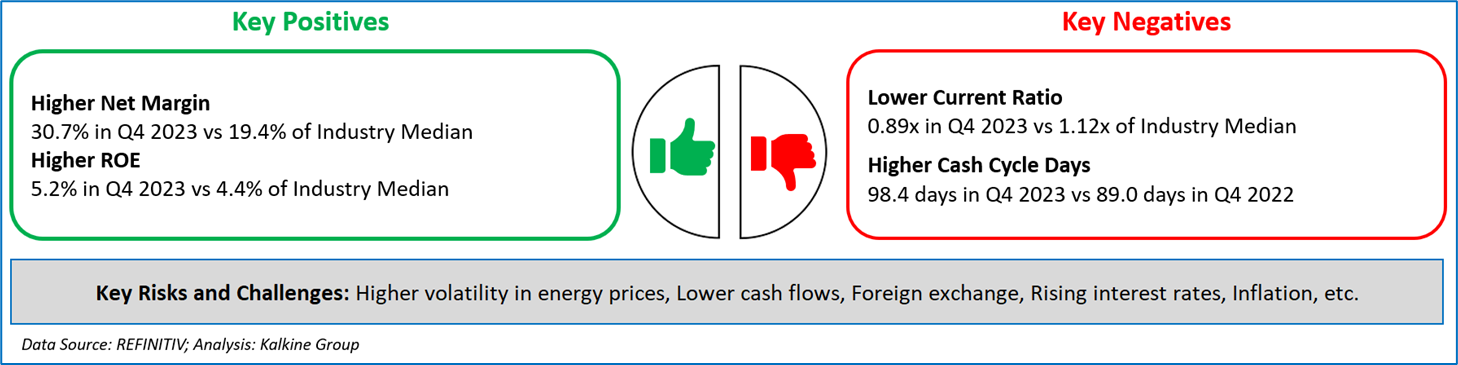
- Frontera Energy Corporation reported an adjusted infrastructure EBITDA of USD 120 million for FY23.
- Its ODL transported around 243,000 bbl/day, and secured EBITDA of USD 285 million in the reporting period.
- In the full fiscal year 2023, FEC experienced a 9.6% drop in top-line business as compared to pcp, primarily due to reduced Brent benchmark crude oil prices.
Canada-based Frontera Energy Corporation is involved in exploring, developing, and producing crude oil and natural gas reserves in South America. Recently, the company confirmed discovery of 228ft of net pay in Kawa-1 and 114ft of net pay in Wei-1 during Guyana Exploration, on North Corentyne.
The company’s adjusted infrastructure EBITDA stood at USD 120 million for the full year. Its ODL transported around 243,000 bbl/day, and secured EBITDA of USD 285 million in the reporting period.
For its onshore business across Colombia and Ecuador Upstream, FEB achieved an average daily production of 40,919 boe/d, with a 9% year-on-year rise in its heavy crude oil production.
In the full fiscal year 2023, FEC experienced a 9.6% drop in top-line business as compared to pcp, primarily because of reduced Brent benchmark oil prices. Also, the firm registered reduced income from operations at USD 154.1 million for the reporting period, following fall in revenue and rise in depreciation and operating cost.
Consequently, the net income before tax was recorded at USD 196.8 million for the full year, versus USD 540.3 million in FY22, while its net income stood at USD 192.7 million in FY 2023, which was USD 291.0 million in pcp.
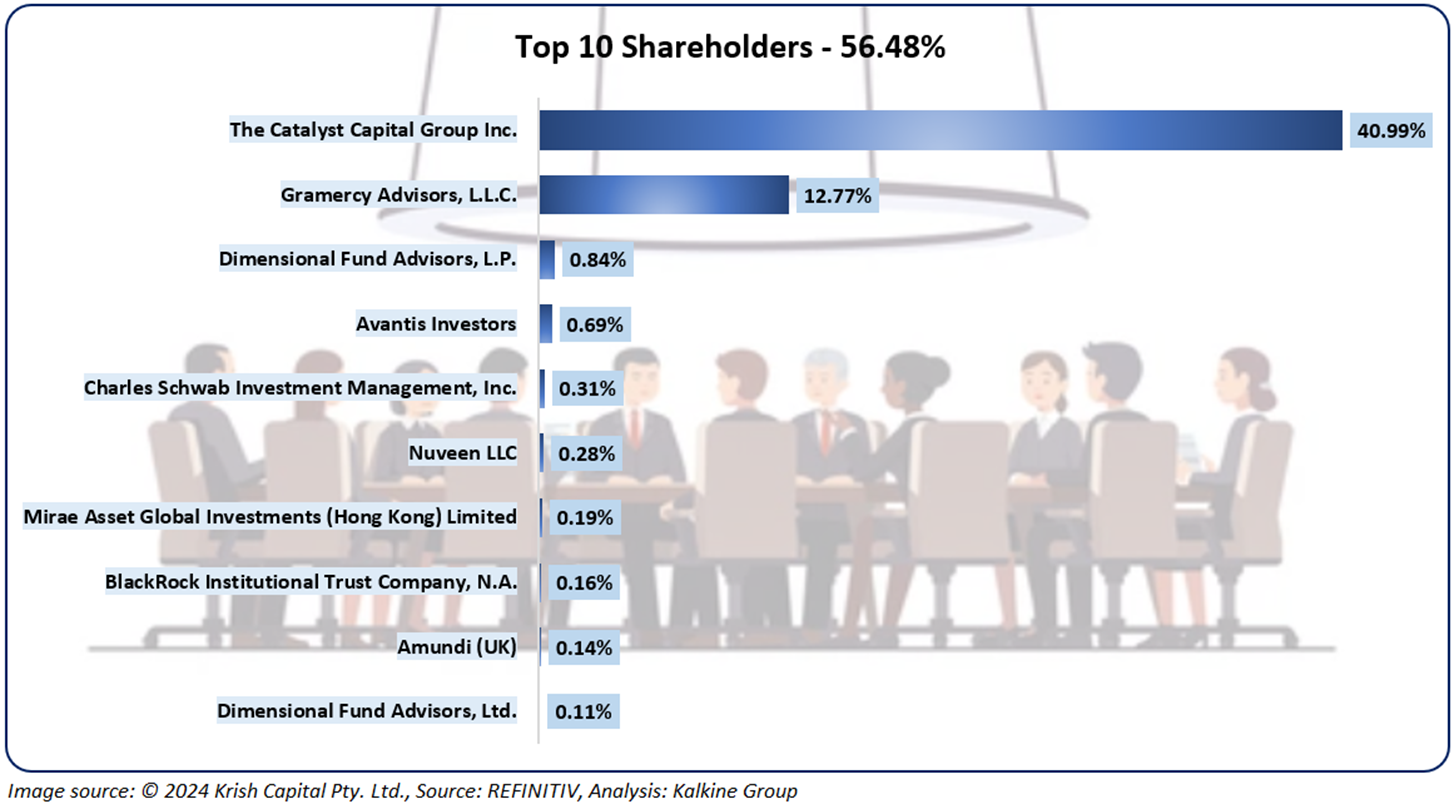
Top 10 Shareholders:
Around 56.48% of the total shareholding is held by its top ten shareholders. While the Catalyst Capital Group Inc. is the biggest shareholder with over 40.99% stake, Gramercy Advisors, L.L.C. is the second biggest shareholder with 12.77% shareholding.
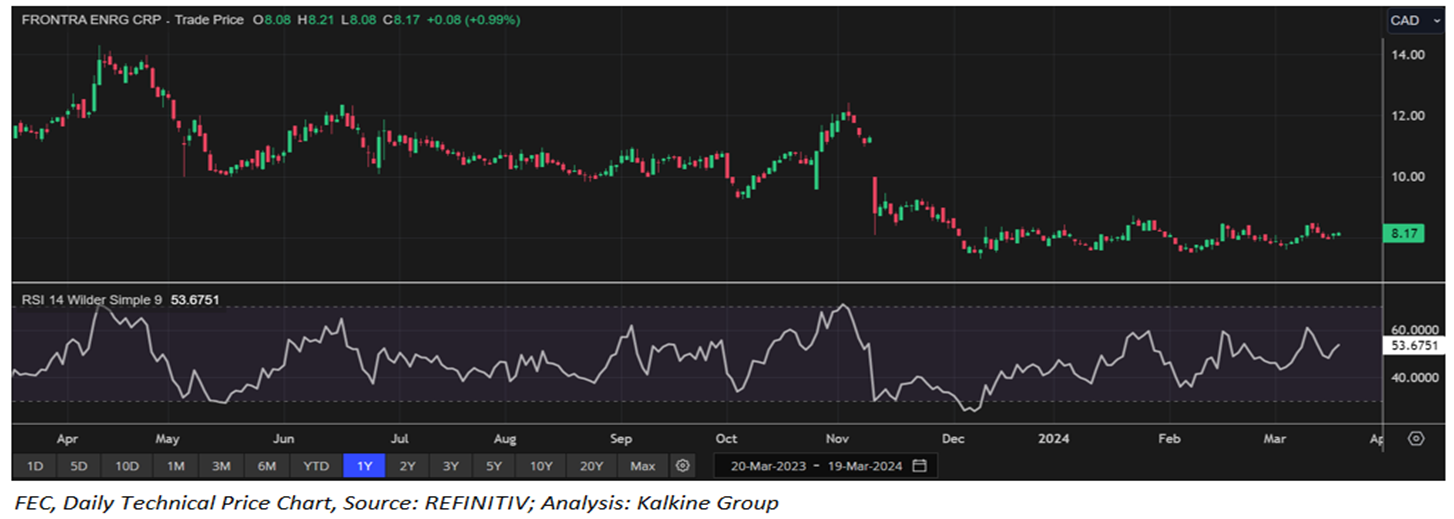
Stock Price Performance
FEC stock price has declined 1.68% over the last one week. It has dropped 2.50% over the last one month. Its 52-week high and low price stand at CAD 14.30 and CAD 7.32, respectively.
Note 1: Past performance is not a reliable indicator of future performance.
Note 2: The reference date for all price data, currency, technical indicators, support, and resistance levels is March 19, 2024. The reference data in this report has been partly sourced from EODHD/Others.


 Please wait processing your request...