Image source: Shutterstock
Highlights
- FY24 saw a 43.5% YoY increase in Imperial Metals’ revenue, reaching CAD 494.4 million, driven largely by the Mount Polley mine
- Income from mine operations turned positive in FY 2024, rising to CAD 161.2 million from a loss of CAD 13.5 million in FY 2023
- Imperial Metals achieved a significant turnaround in income before taxes, reaching CAD 111.6 million in FY24, compared to a loss of CAD 62.2 million in FY23
- The company posted a net income of CAD 106.3 million in FY24, reversing a net loss of CAD 36.7 million in the prior year
- Red Chris is set to increase copper and gold production in FY25, with a 50% boost in gold output compared to FY 2024 levels
Imperial Metals Corporation (TSX:III) is a Vancouver-based mining company. The company’s principal properties in British Columbia include the wholly owned Mount Polley and Huckleberry copper mines, a 30% interest in the Red Chris mine.
In the financial year 2024 (FY24), the company experienced a remarkable 43.5% YoY increase in total revenue, reaching CAD 494.4 million compared to CAD 344.5 million in FY23. This growth was largely driven by the Mount Polley mine, which generated CAD 301.5 million in revenue from copper concentrate, up from CAD 233.3 million in the prior year, reflecting a significant CAD 68.2 million increase.
Income from mine operations saw an impressive recovery, surging to CAD 161.2 million in FY24, compared to a loss of CAD 13.5 million in FY23. This turnaround, amounting to a remarkable improvement of CAD 174.7 million, was attributed to higher revenue and a reduction in the cost of sales.
Income before taxes also showed a significant improvement, turning positive at CAD 111.6 million in FY24, compared to a loss of CAD 62.2 million in the previous year. The turnaround was largely driven by the increased revenue and a better performance in mine operations.
Net income in FY24 reached CAD 106.3 million, or CAD 0.66 per share, marking a sharp recovery from a net loss of CAD 36.7 million (CAD -0.23 per share) in FY23. This improvement of CAD 142.3 million was primarily driven by higher revenue and the boost in income before taxes.
Company Outlook
As per the company, copper and gold production at Red Chris is projected to increase in FY 2025, as the mining strategy will prioritize higher-grade ore. This includes a 50% boost in gold production compared to FY 2024 levels.
For Mount Polley, the production target for FY 2025 is set at 25.0 - 27.0 million pounds of copper and 35,000 - 40,000 ounces of gold. While the gold production goal remains unchanged from FY 2024, the copper production target is slightly lower. The higher-grade ore in the Phase 4 Springer Pit is expected to be fully mined by the third quarter of 2025. In the fourth quarter, ore from the Phase 5 pushback in the Springer Pit, which has lower copper grades, will start being processed.
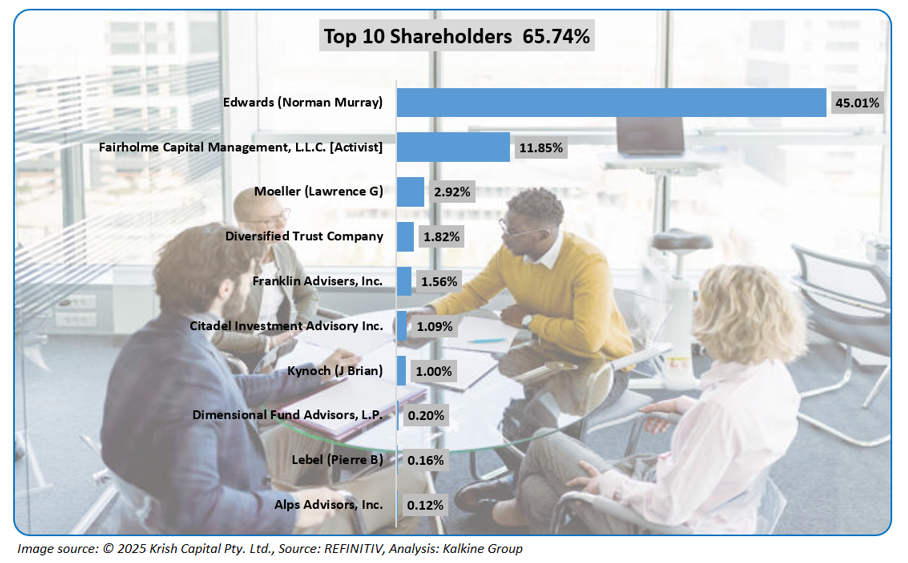
Top 10 Shareholders
The top 10 shareholders of Imperial Metals collectively own approximately 65.74% of the company’s total shares. Norman Murray Edwards and Fairholme Capital Management, L.L.C. hold the largest stakes, with Edwards owning around 45.01% and Fairholme Capital Management holding about 11.85%.
Stock Information
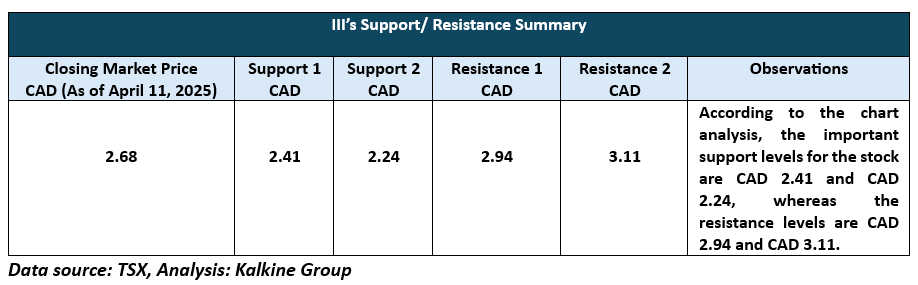
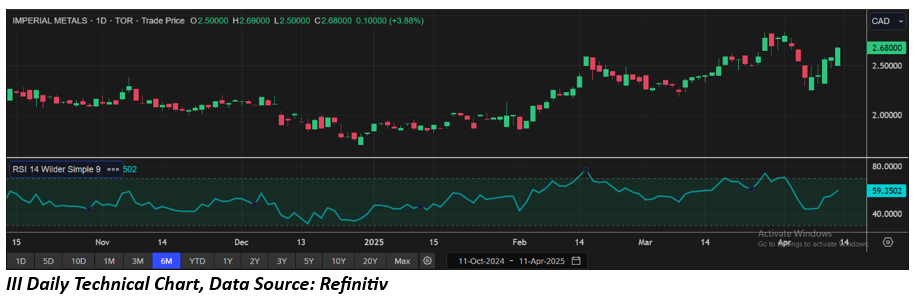
The stock has surged approximately 12.60% in the past week and gained around 11.66% over the last month. It is currently trading above the midpoint of its 52-week high of CAD 2.84 and low of CAD 1.70. As of April 11, 2025, the stock closed at CAD 2.68.
Note 1: Past performance is not a reliable indicator of future performance.
Note 2: The reference data for all price data, currency, technical indicators, support, and resistance levels is April 11, 2025. The reference data in this report has been partly sourced from EODHD/Others.
Technical Indicators Defined
Support: A level at which the stock prices tend to find support if they are falling, and a downtrend may take a pause backed by demand or buying interest. Support 1 refers to the nearby support level for the stock and if the price breaches the level, then Support 2 may act as the crucial support level for the stock.
Resistance: A level at which the stock prices tend to find resistance when they are rising, and an uptrend may take a pause due to profit booking or selling interest. Resistance 1 refers to the nearby resistance level for the stock and if the price surpasses the level, then Resistance 2 may act as the crucial resistance level for the stock.


 Please wait processing your request...