_11_05_2025_03_53_08_551671.png)
Highlights
- Killam Apartment REIT has posted a 5.4% YoY increase in Q2 2025 property revenue, supported by higher rental rates and same-property growth.
- Funds from operations rose 7.4% YoY in Q2 2025, offsetting weaker net income caused by lower fair value gains on properties.
- Management raised its 2025 same-property NOI forecast to over 6%, exceeding earlier guidance of 4–7%.
- The REIT achieved the midpoint of its CAD 127.9 million asset recycling goal while maintaining a conservative 39.6% debt-to-assets ratio.
Killam Apartment Real Estate Investment Trust (TSX:KMP.UN) operates as an open-ended mutual fund trust focused on residential real estate. Its core business includes acquiring, managing, and developing multi-residential apartment complexes and manufactured home communities (MHC) across Canada.
The company’s second quarter of 2025 (Q2 2025) reported a 5.4% YoY increase in property revenue, driven by higher rental rates and same-property growth, while net operating income rose 6.9% YoY due to disciplined expense management despite higher taxes and utilities.
However, net income fell 71% YoY because of reduced fair value gains on investment properties, although funds from operations improved by 7.4% YoY due to higher operating income and contributions from new developments, partly offset by higher interest costs.
Recent Business Update
Killam Apartment REIT has made significant progress in its sustainability journey, as reflected by its improved GRESB score of 82 for 2025, which is three points higher than the previous year.
In addition, the REIT announced its steady monthly distribution for October 2025 at CAD 0.06 per unit, scheduled for payment on November 17 to holders as of October 31. The REIT continues to promote long-term investment by supporting unitholders’ participation in its DRIP program, which offers a 3% bonus for reinvested distributions.
Company Outlook
KMP.UN is ahead of its 2025 targets, with same-property net operating income now projected to rise over 6%, exceeding the 4–7% guidance range. The REIT has achieved the midpoint of its asset recycling goal, completing CAD 127.9 million in sales, while diversifying its income base—as 39.6% of NOI now comes from outside Atlantic Canada, supported by new acquisitions in Waterloo and Ottawa. The REIT maintains a reasonable 39.6% debt-to-assets ratio, and has set aside about CAD 6 million for sustainability initiatives, all supporting a steady, long-term growth outlook.
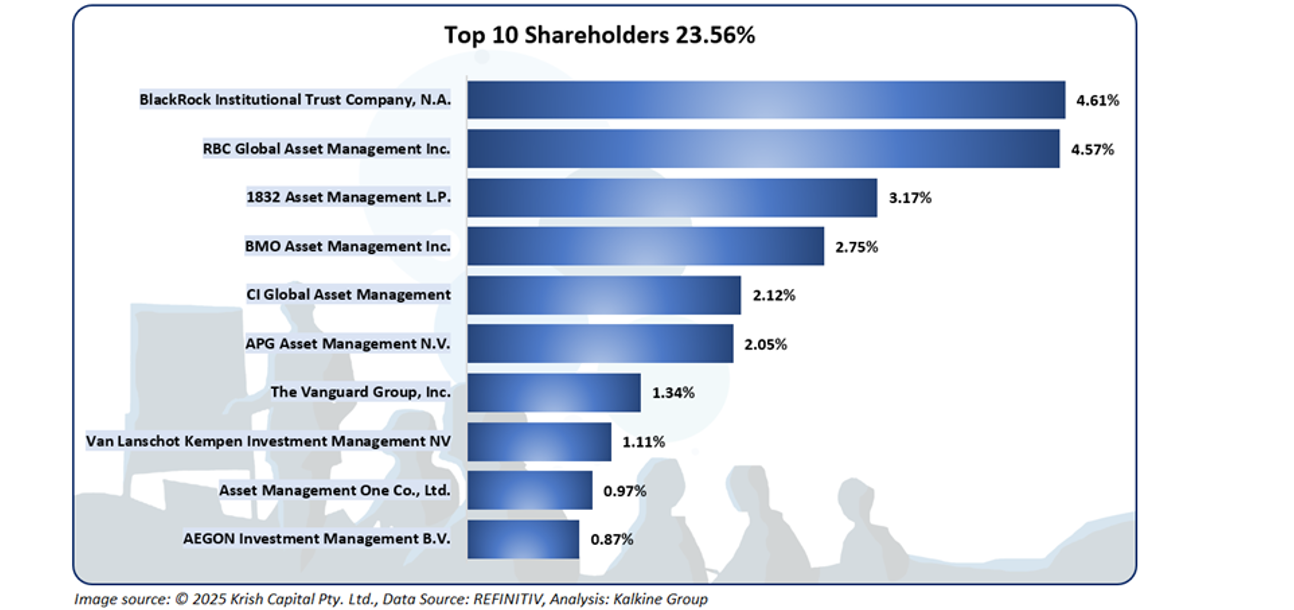
Top 10 Shareholders
The REIT’s shareholder base is relatively diversified, with the top 10 investors collectively owning around 23.56% of the total units. Among them, BlackRock Institutional Trust Company and RBC Global Asset Management Inc. are the largest holders, with stakes of approximately 4.61% and 4.57%, respectively.
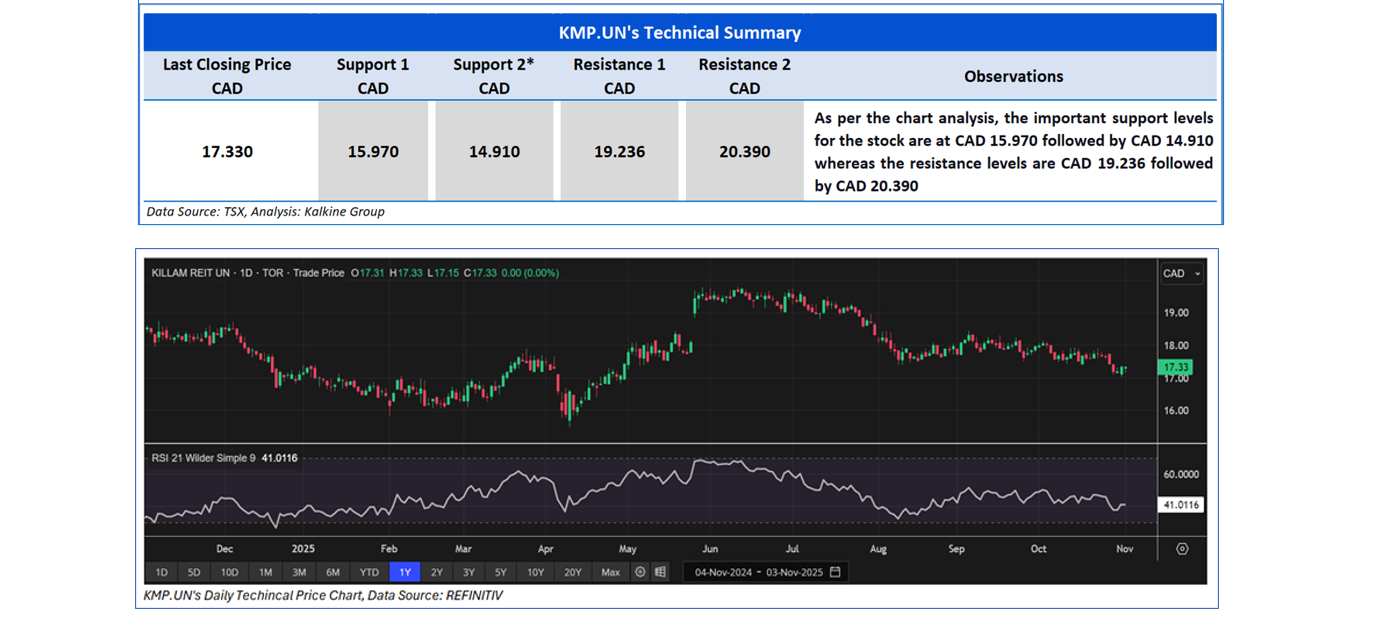
Stock Information
The stock has witnessed a downside of ~1.86% and ~3.82% over the past week and past month, respectively. Moreover, it is trading below the average 52-week high price of CAD 19.80 and 52-week low price of CAD 15.48.
Note 1: Past performance is not a reliable indicator of future performance.
Note 2: The reference data for all price data, currency, technical indicators, support, and resistance levels is 03 November 2025. The reference data in this report has been partly sourced from EODHD/Others.
Technical Indicators Defined
Support: A level at which the stock prices tend to find support if they are falling, and a downtrend may take a pause backed by demand or buying interest. Support 1 refers to the nearby support level for the stock and if the price breaches the level, then Support 2 may act as the crucial support level for the stock.
Resistance: A level at which the stock prices tend to find resistance when they are rising, and an uptrend may take a pause due to profit booking or selling interest. Resistance 1 refers to the nearby resistance level for the stock and if the price surpasses the level, then Resistance 2 may act as the crucial resistance level for the stock.


 Please wait processing your request...