
Image source: © Senodenimous | Megapixl.com
Highlights
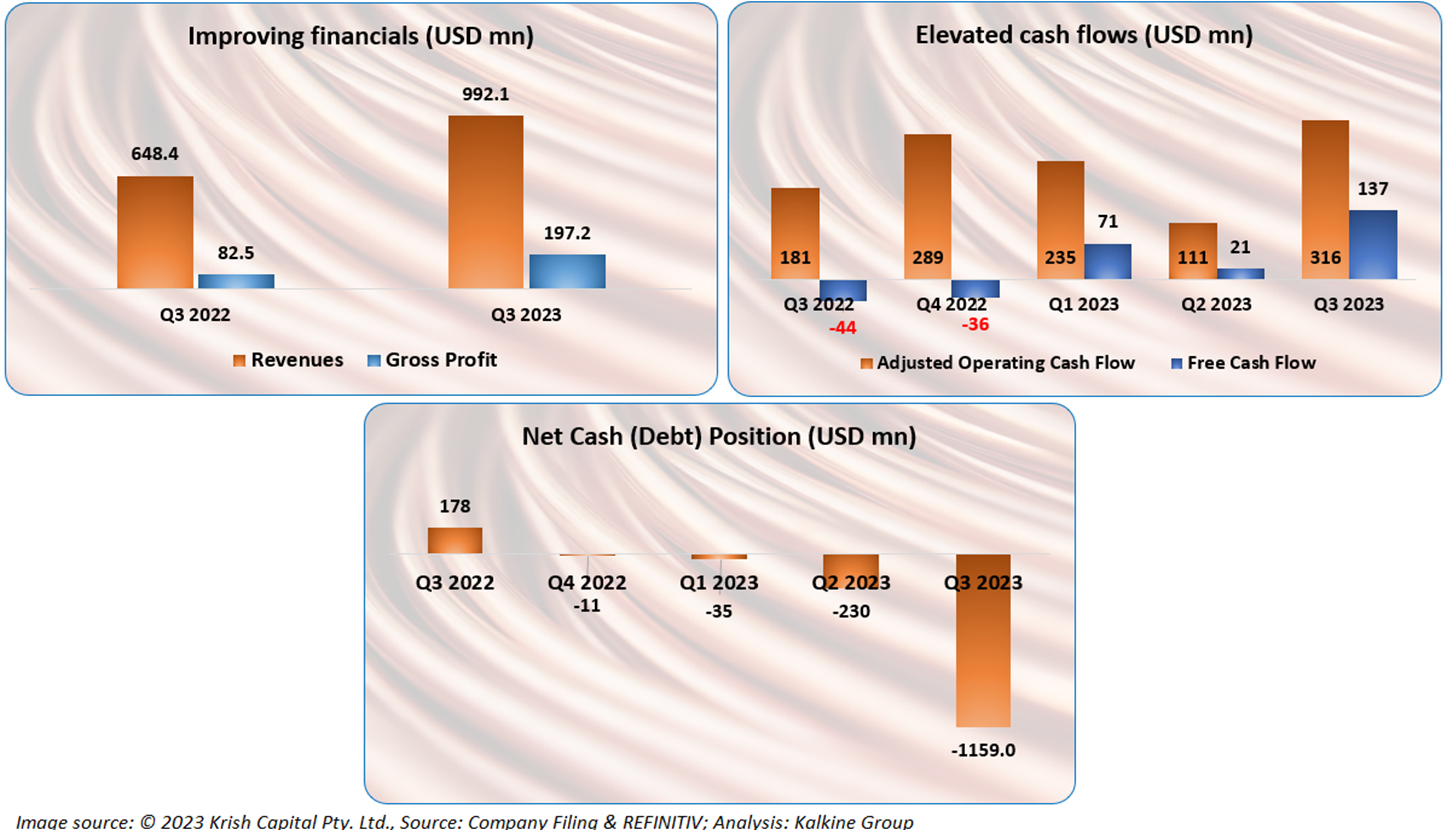
- Lundin Mining Corporation saw its top-line business grow by over 53% from USD 648.4 million in Q3 2022 to USD 992.1 million in Q3 2023.
- Its gross profit increased from USD 82.5 million in Q3 2022 to USD 197.2 million in Q3 2023.
- LUN’s adjusted EBITDA grew from USD 202 million in pcp to USD 415 million for the reporting period.
Canada-based diversified base metals mining company, Lundin Mining Corporation (TSX: LUN) is involved in mining, exploration, and development of mineral properties in the USA, Portugal, Sweden Chile, and Brazil. Its main interest lies in production of gold, copper, zinc, and nickel.
In Q3 2023, the company saw its top-line business grow by over 53% from USD 648.4 million in Q3 2022 to USD 992.1 million. This was mainly because of increase in production as well as realized copper price. Its gross profit increased from USD 82.5 million in Q3 2022 to USD 197.2 million in Q3 2023. LUN’s adjusted EBITDA grew from USD 202 million in pcp to USD 415 million for the reporting period.
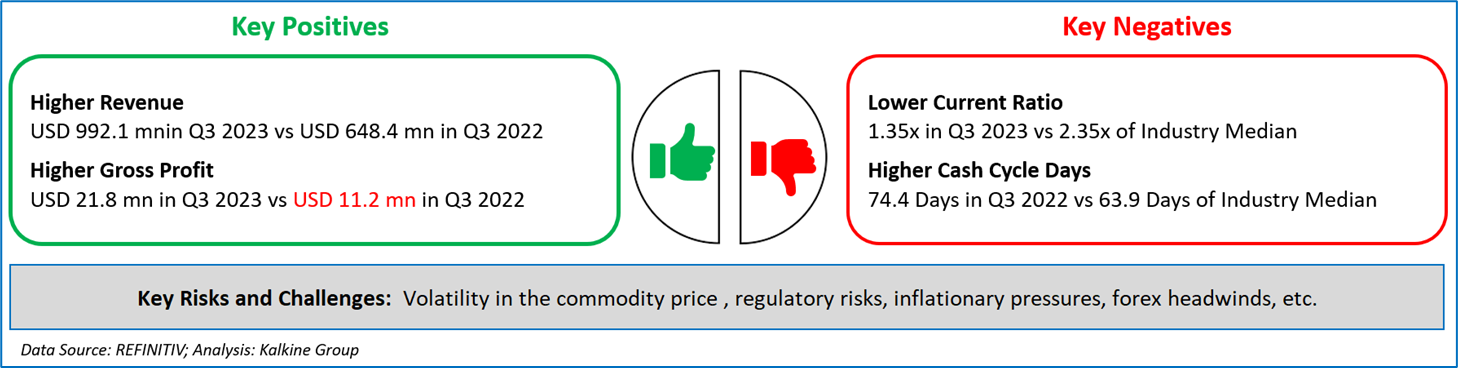
Lundin Mining Corporation’s adjusted cash flows stood at USD 316 million in Q3 2023 as compared to USD 181 million in the previous corresponding period. Its free cash flow was recorded at USD 137 million in Q3 2023, versus negative free cash flow of USD 44 million in pcp. Overall, the company was able to turn its net loss of USD 11.2 million in Q3 2022 to a net profit of USD 21.8 million in Q3 2023.
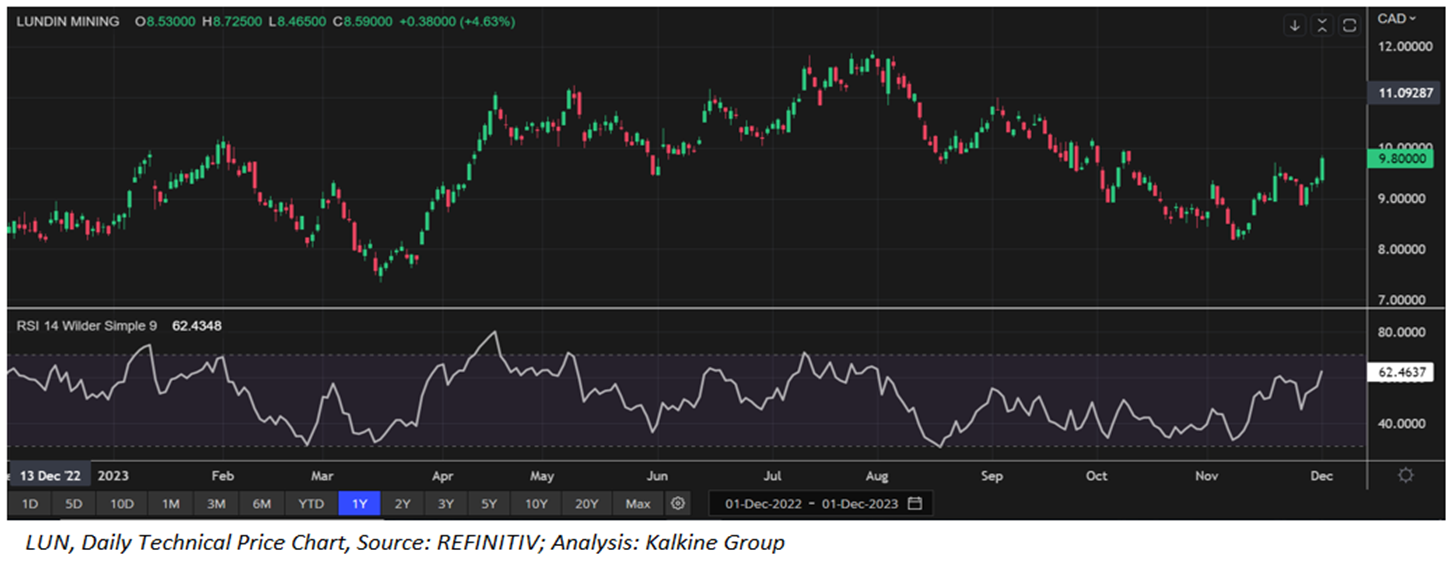
The company has announced a dividend distribution of CAD 0.09 per common share. Also, LUN offered a healthy dividend yield of 3.67% on December 1, 2023, with a closing price of CAD 9.80.
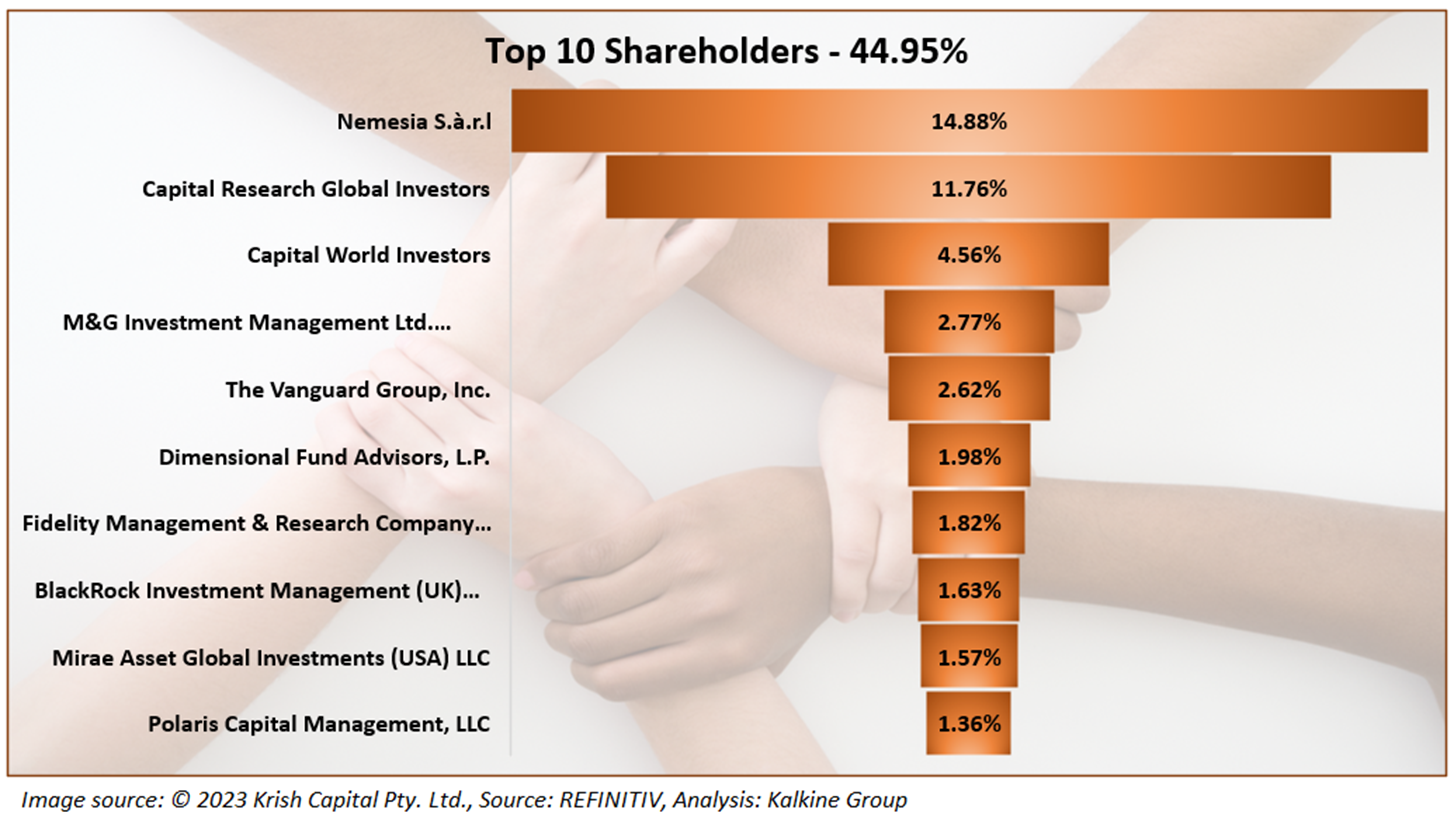
Top 10 Shareholders:
Around 44.95% of the total shareholding in the firm is held by its top ten shareholders. While Nemesia S.à.r.l holds maximum stake in the company of 14.88%, Capital Research Global Investors owns over 11.76% shareholding.
Stock Price Performance
LUN’s stock price increased by approximately 4.81% in the past one week. It has gained more than 5.7% over the last one month. The stock’s 52-week high and low price stand at CAD 11.93 and CAD 7.35, respectively.
Note 1: Past performance is not a reliable indicator of future performance.
Note 2: The reference date for all price data, currency, technical indicators, support, and resistance levels is December 1, 2023. The reference data in this report has been partly sourced from EODHD/Others.


 Please wait processing your request...