_07_31_2025_10_04_57_055825.png)
Image source: © 2025 Krish Capital Pty.Ltd
Highlights
- MEQ reported an 11.9% YoY increase in Q2FY25 rental and ancillary revenue to CAD 68.5 million.
- MEQ recorded a 172.0% YoY rise in net profit and total comprehensive income to CAD 91.4 million.
- MEQ declared a quarterly dividend of CAD 0.04 per share, supported by sustained rental demand and supply constraints.
Mainstreet Equity Corp (TSX: MEQ) is a Canadian residential real estate company focused on acquiring, redeveloping, and managing mid-market multi-family rental apartments across British Columbia, Alberta, Saskatchewan, and Manitoba, generating revenue primarily from rental income.
In the second quarter of the financial year 2025 (Q2FY25), Mainstreet Equity Corp’s total rental and ancillary revenue increased by 11.9% YoY to CAD 68.5 million, primarily driven by an increase in the average monthly rental rates. Net operating income rose by 14.8% YoY to CAD 42.7 million, supported by controlled property operating expenses and revenue growth. Profit before income tax surged 158.5% YoY to CAD 108.3 million, largely due to fair value adjustments, though partially offset by increased finance costs. Net profit and total comprehensive income grew by 172.0% YoY to CAD 91.4 million, with gains tempered slightly by higher income taxes.
Business Update
Mainstreet Equity Corp declared a quarterly dividend of CAD 0.04 per share for Q2FY25, payable on July 31, 2025, to shareholders on record as of July 17. The company continues to benefit from population growth, rising average rents, and a slow-responding housing supply, which are expected to drive sustained growth and value creation.
Company Outlook
MEQ anticipates continued rental market strength, as policy shifts fail to ease demand pressures, contributing to a 10% rise in same-asset NOI.
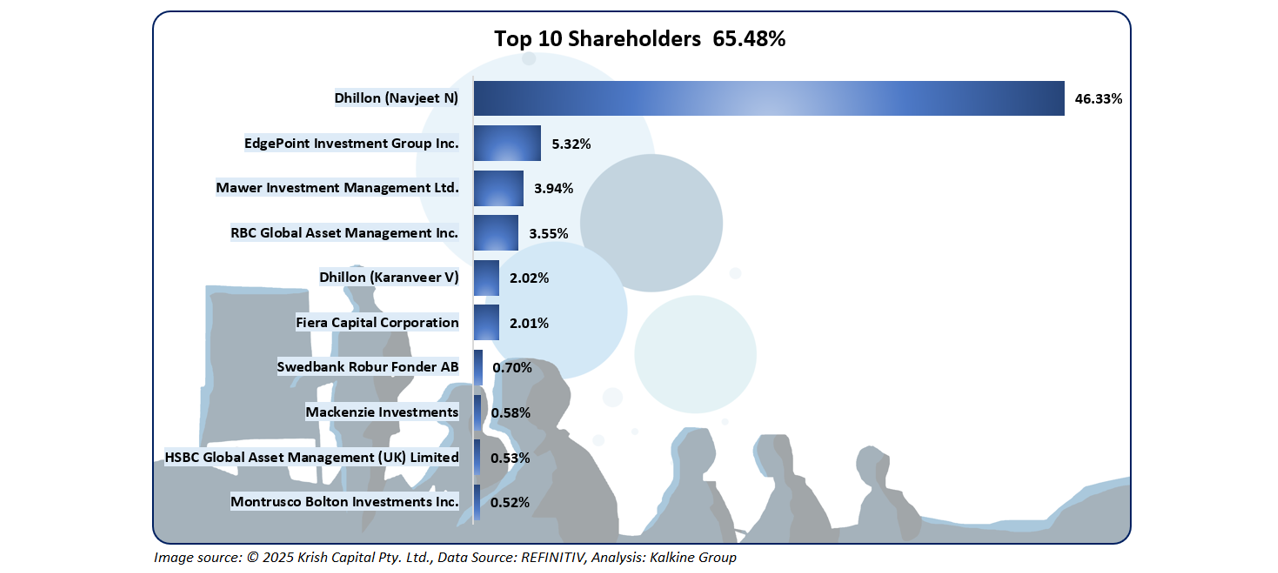
Top 10 shareholders
The top 10 shareholders collectively hold approximately 65.48% of the company’s total shares, with Navjeet N Dhillon and EdgePoint Investment Group Inc. holding the largest stakes at around 46.33% and 5.32%, respectively.
Stock Information
The stock has increased approximately 0.35% over the past month and declined around 9.60% over the past six months. As of July 29, 2025, it closed at CAD 186.67, trading above the average 52-week low of CAD 179.5 and 52-week high of CAD 216.37.
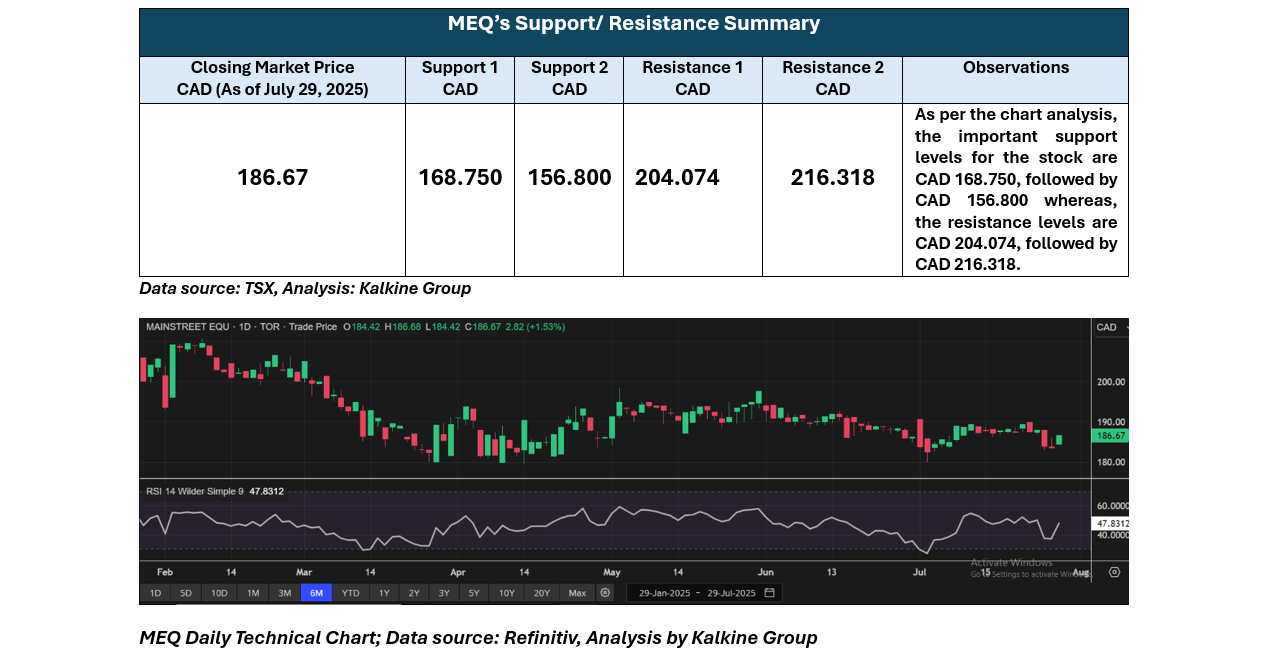
Note 1: Past performance is not a reliable indicator of future performance.
Note 2: The reference data for all price data, currency, technical indicators, support, and resistance levels Is 29 July 2025. The reference data in this report has been partly sourced from EODHD/Others.
Technical Indicators Defined
Support: A level at which the stock prices tend to find support if they are falling, and a downtrend may take a pause backed by demand or buying interest. Support 1 refers to the nearby support level for the stock and if the price breaches the level, then Support 2 may act as the crucial support level for the stock.
Resistance: A level at which the stock prices tend to find resistance when they are rising, and an uptrend may take a pause due to profit booking or selling interest. Resistance 1 refers to the nearby resistance level for the stock and if the price surpasses the level, then Resistance 2 may act as the crucial resistance level for the stock.


 Please wait processing your request...