
Highlights
- MDI’s Q1 2026 revenue rose 19.2% YoY to CAD 226.6 million.
- Net earnings declined to CAD 10.1 million in Q1 2026 from CAD 15.8 million in the prior year.
- The stock gained ~6.18% weekly and ~35.90% over the past three months.
Major Drilling Group International Inc. (TSX:MDI) operates in the contract drilling sector, delivering drilling services to companies engaged in mining and mineral exploration activities.
MDI’s recent quarterly (Q1 2026) results show a mix of positives and negatives for the business. On the positive side, revenue increased to CAD 226.6 million in Q1 2026 from CAD 190.0 million in Q1 2025. Gross profit also ticked up slightly to CAD 42.1 million versus CAD 41.9 million a year earlier.
However, there are some notable negatives within the cost structure and earnings profile. General and administrative expenses rose to CAD 21.3 million in Q1 2026 from CAD 18.2 million in Q1 2025. Net earnings declined to CAD 10.1 million compared to CAD 15.8 million in the prior-year quarter.
A closer look at the income statement confirms that the company is growing the top line but facing profitability headwinds. Total revenue grew 19.2% year over year to CAD 226.6 million, demonstrating higher demand and better project execution. Gross profit remained essentially flat at around CAD 42 million, while earnings before tax fell from CAD 20.8 million to CAD 14.0 million, a drop of roughly one-third as lower margins and higher expenses weighed on profitability.
Company Outlook
As per the company, improving activity trends into Q2 and FY26 are evident, with April–July showing stronger project mobilizations that have reversed the earlier slow start to the calendar year. New project wins, while initially dilutive to margins, point to healthier utilization levels ahead as these contracts ramp up.
Stock Information
The stock has gained approximately 9.12% over the past week and around 34.71% in the last three months. It is also trading above its 52-week range, which spans from a low of CAD 6.51 to a high of CAD 14.41.
Note 1: Past performance is not a reliable indicator of future performance.
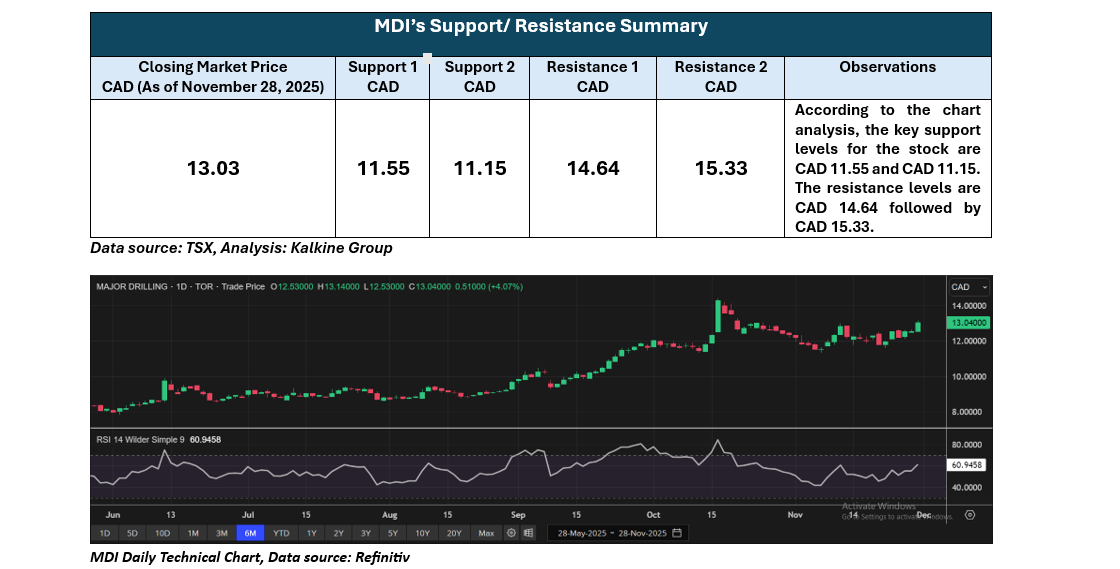
Note 2: The reference data for all price data, currency, technical indicators, support, and resistance levels is 28 Nov 2025. The reference data in this report has been partly sourced from EODHD/Others.
Technical Indicators Defined
Support: A level at which the stock prices tend to find support if they are falling, and a downtrend may take a pause backed by demand or buying interest. Support 1 refers to the nearby support level for the stock and if the price breaches the level, then Support 2 may act as the crucial support level for the stock.
Resistance: A level at which the stock prices tend to find resistance when they are rising, and an uptrend may take a pause due to profit booking or selling interest. Resistance 1 refers to the nearby resistance level for the stock and if the price surpasses the level, then Resistance 2 may act as the crucial resistance level for the stock.


 Please wait processing your request...