
Image source: Shutterstock
Highlights
- Metro saw a 2.9% YoY sales increase in Q1 2025, reaching CAD 5,117.1 million
- Gross profit for Q1 2025 rose by 3.6% YoY, reaching CAD 1,008.3 million, driven by higher revenue
- Metro's net earnings increased by 13.6% YoY, totaling CAD 259.5 million in Q1 2025
- The company aims for 8-10% annual growth in adjusted net earnings per share over the long term
Metro Inc. (TSX:MRU), a major grocery retailer in Canada, operates well-known grocery banners such as Super C, Metro Plus, Food Basics, and Metro. Additionally, its pharmacies are primarily branded under Jean Coutu and Brunet.
In the first quarter of 2025 (Q1 2025), Metro Inc. reported a 2.9% YoY increase in sales, reaching CAD 5,117.1 million, compared to CAD 4,974.2 million in Q1 2024. This growth was largely driven by higher same-store sales, increased online food sales, and a boost in Pharmacy same-store sales. The company also saw a 3.6% YoY increase in gross profit, reaching CAD 1,008.3 million, which was primarily attributed to the higher revenue levels. Earnings before income taxes for the quarter rose by 4.1% YoY, amounting to CAD 317.2 million, a result of increased revenue and an improvement in gross profit.
Metro's net earnings saw a notable increase of 13.6% YoY, reaching CAD 259.5 million in Q1 2025, up from CAD 228.5 million in the previous year. This growth was primarily driven by the retail segment's improved revenue and the boost in earnings before income taxes.
Company Outlook
The company anticipates a gradual return to growth in FY25 and remains dedicated to its long-term goal of achieving an annual increase of 8% to 10% in adjusted net earnings per share.
Stock Information
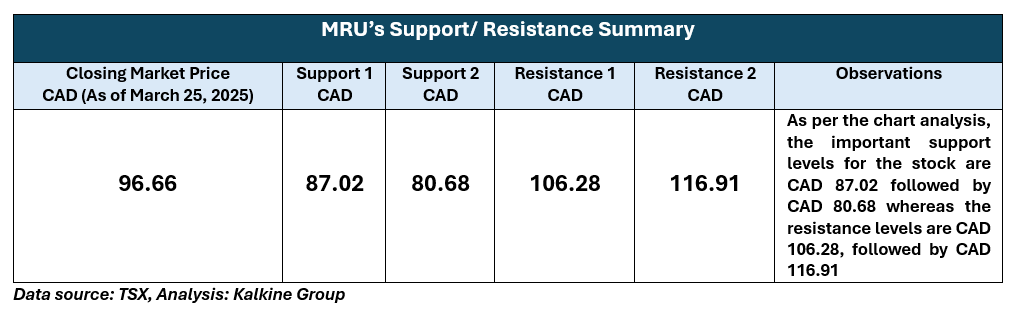
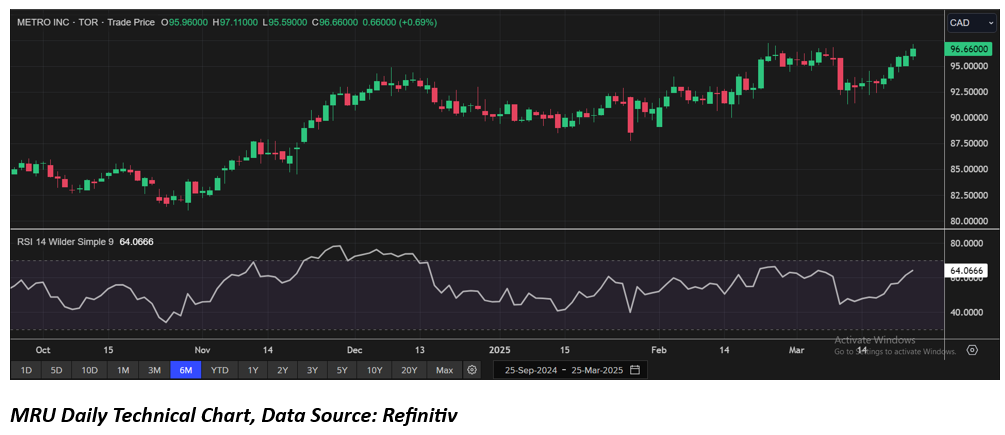
The stock price of MRU has appreciated by around 13.44% and ~19.46% in the past month and past six months, respectively. The stock’s 52-week low and high spans from CAD 4.95 to CAD 9.70. As of 25 February 2025, the stock’s closing price is CAD 96.66.
Note 1: Past performance is not a reliable indicator of future performance.
Note 2: The reference data for all price data, currency, technical indicators, support, and resistance levels is 25 March 2025. The reference data in this report has been partly sourced from EODHD/Others.
Technical Indicators Defined
Support: A level at which the stock prices tend to find support if they are falling, and a downtrend may take a pause backed by demand or buying interest. Support 1 refers to the nearby support level for the stock and if the price breaches the level, then Support 2 may act as the crucial support level for the stock.
Resistance: A level at which the stock prices tend to find resistance when they are rising, and an uptrend may take a pause due to profit booking or selling interest. Resistance 1 refers to the nearby resistance level for the stock and if the price surpasses the level, then Resistance 2 may act as the crucial resistance level for the stock.


 Please wait processing your request...