
Image source: Shutterstock
Highlights
- In FY24, Morguard Corporation reported a net operating income (NOI) of CAD 566.9 million, down 4.8% from the previous year
- Other income turned positive in FY24, reaching CAD 28.1 million, compared to a loss of CAD 211.6 million in FY23
- Net income surged by 311.7% in FY24, reaching CAD 239.6 million, fueled by reduced expenses and higher other income
- The company reported CAD 333.0 million in cash and credit facilities at year-end and announced the start of a new 431-suite rental community in Mississauga, Ontario
Morguard Corporation (TSX:MRC) is a real estate company that acquires, owns, and develops properties in Canada and the United States.
In the fiscal year 2024 (FY24), Morguard Corporation reported a net operating income (NOI) of CAD 566.9 million, a 4.8% decline from the CAD 595.4 million recorded in FY23. This drop was primarily due to a lower contribution from hotel properties, alongside higher property operating costs and realty taxes.
On the other hand, total expenses for FY24 decreased by 2.3% to CAD 355.6 million from CAD 363.8 million in FY23. This reduction was largely driven by lower amortization costs of hotel properties. The company successfully managed to reduce its total expenses despite facing challenges in other operational areas.
A notable highlight was the company's performance in other income (expenses), which turned positive, reaching CAD 28.1 million in FY24, a notable improvement from a loss of CAD 211.6 million in FY23. This positive shift was primarily attributed to a gain of CAD 150.5 million from the sale of hotel properties, which bolstered the company's other income. As a result, net income for FY24 soared to CAD 239.6 million, marking a 311.7% increase from the CAD 58.2 million reported in FY23. The rise in net income was driven by reduced expenses and higher other income, although it was partially offset by elevated taxes.
Furthermore, in FY24, the company achieved an operating margin of 26.5% and a net margin of 21.3%, both higher than the industry median of 6.3% and 2.5%, respectively. However, the company had a higher debt-to-equity ratio of 1.37x in FY24 versus 0.44x of the industry median.
Recent Business Update
On an announcement dated February 20, 2025, the company reported CAD 333.0 million in cash and available credit facilities at the end of the year. Additionally, the company holds a CAD 1.1 billion pool of unencumbered properties and other investments.
On the same day, the company also announced the commencement of construction for a new purpose-built rental community in Mississauga, Ontario. The project, which formally began development, would consist of a 431-suite complex featuring nine-story and two eight-story mid-rise residential buildings.
Company Outlook
As per the company, the outlook for North America's commercial property sector in 2025 is relatively positive. With supply and demand remaining well-balanced, Canada's multi-suite residential rental market is expected to see vacancy rates stabilize in the short term. Rents are projected to experience modest increases, building on the record growth observed in 2023 and the first half of 2024.
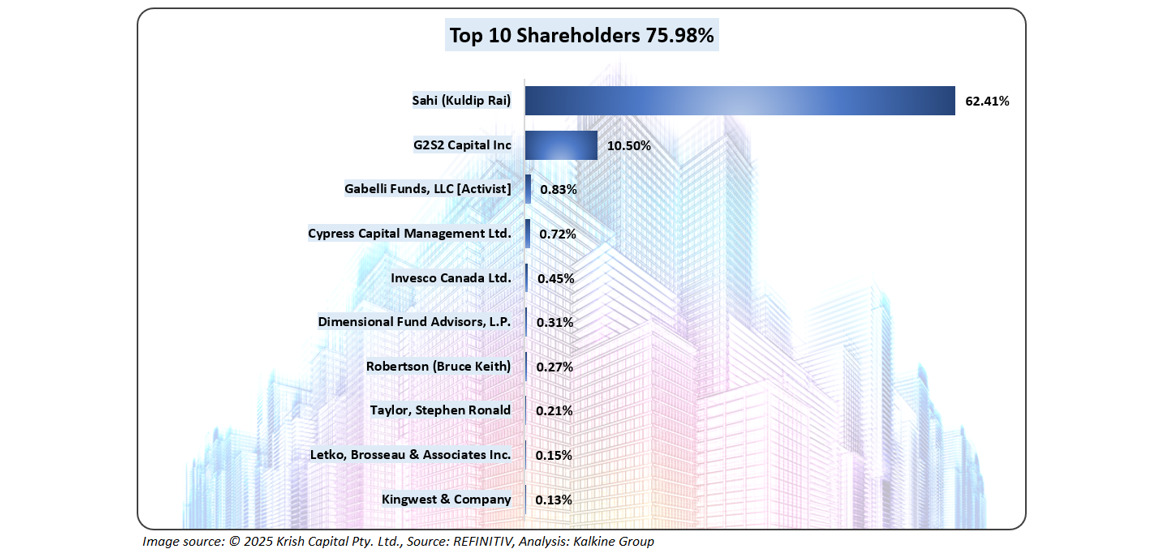
Top 10 Shareholders
The top 10 shareholders of MRC together account for approximately 75.98% of the total shareholding in the company. Sahi (Kuldip Rai) and G2S2 Capital Inc. hold a maximum stake in the company at ~62.41% and ~10.50%, respectively.
Stock Information
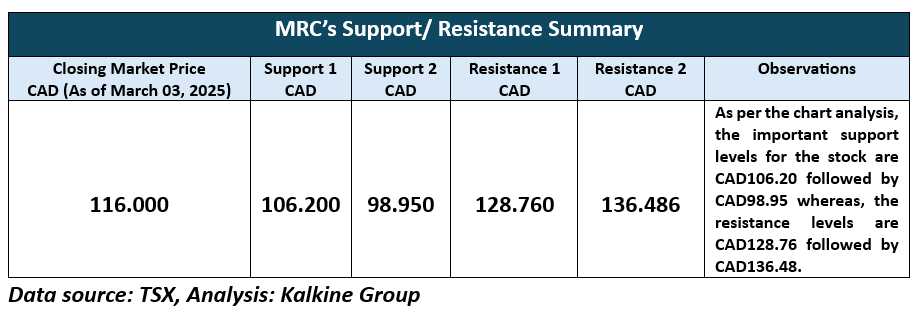
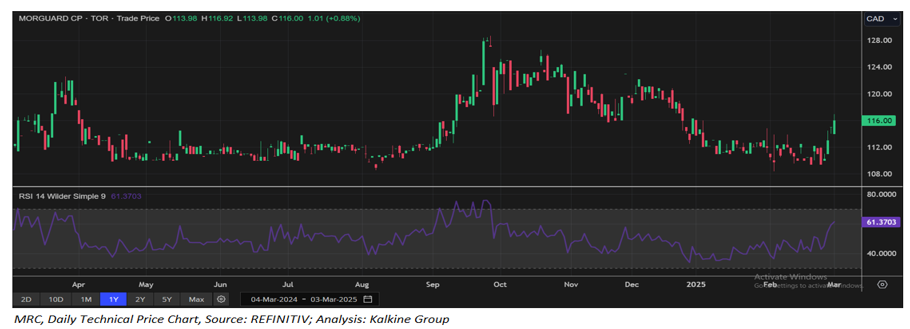
The stock has gained approximately 3.70% over the past week and 3.59% over the last month. Additionally, it is currently trading below the average of its 52-week high of CAD 128.69 and its 52-week low of CAD 108.35, with a closing price of CAD 116.00 as of March 3, 2025.
Note 1: Past performance is not a reliable indicator of future performance.
Note 2: The reference data for all price data, currency, technical indicators, support, and resistance levels is March 03, 2025. The reference data in this report has been partly sourced from EODHD/Others.
Technical Indicators Defined
Support: A level at which the stock prices tend to find support if they are falling, and a downtrend may take a pause backed by demand or buying interest. Support 1 refers to the nearby support level for the stock and if the price breaches the level, then Support 2 may act as the crucial support level for the stock.
Resistance: A level at which the stock prices tend to find resistance when they are rising, and an uptrend may take a pause due to profit booking or selling interest. Resistance 1 refers to the nearby resistance level for the stock and if the price surpasses the level, then Resistance 2 may act as the crucial resistance level for the stock.


 Please wait processing your request...