
Highlights
- North West Company reported a 12.9% rise in net income for Q3 2026 despite a slight sales dip
- Management expects continued earnings growth supported by the Next 100 initiative and disciplined cost control
- EBITDA margin of 14.2% significantly exceeds the industry median
- Capital returns through dividends and share buybacks aim to enhance shareholder value despite a low-growth sales environment
North West Company Inc. (TSX:NWC) is a Canadian retailer focused on serving underserved rural communities and urban neighbourhoods. The company offers a wide range of products, including food, family apparel, housewares, appliances, and outdoor goods, with food making up the largest portion of its revenue. Beyond retail, North West provides additional services such as postal operations, income tax preparation, money transfers, and commercial sales. Its operations are divided into Canadian and international segments, with most of the revenue generated within Canada.
Financial Performance
North West reported a slight decrease in sales for Q3 2026, with CAD 634.3 million compared to CAD 637.4 million in Q3 2025, marking a 0.5% year-on-year decline primarily due to lower same-store sales in Canadian operations. Despite this, gross profit rose by 1.4% to CAD 217.1 million, benefiting from changes in the sales mix and positive impacts from the company’s Next 100 initiatives.
Earnings from operations increased 8.5% to CAD 58.7 million, driven by higher gross profit and controlled operating expenses. Net income grew by 12.9% to CAD 41 million, supported by these factors but partially offset by higher income taxes. Additionally, the company maintained a healthy liquidity position, reflected in a current ratio of 2.26, significantly higher than the industry median of 1.16, indicating high operational efficiency and financial stability. The company’s profitability metrics has also outpaced industry medians, with EBITDA margin at 14.2% versus the industry’s 5.7%.
Recent Update
The board announced a quarterly dividend of CAD 0.41 per share, scheduled for payment on January 15, 2026. This decision reflects management’s confidence in the company’s ability to maintain strong and reliable cash flows. The dividend remains well supported by both earnings and adjusted EBITDA, even in a softer sales environment, and continues to benefit from margin improvements driven by the Next 100 initiative.
Company Outlook
Looking ahead, the company claims to be well-positioned to increase earnings despite a challenging environment of slow sales growth. The company expects ongoing benefits from its Next 100 initiative, disciplined cost management, and steady demand for essential goods to support margin improvement and consistent cash flow. Additionally, capital returns through dividends and share buybacks are expected to enhance shareholder value, while operational efficiencies aim to lessen dependence on external funding challenges.
Top 10 Shareholders
The top 10 shareholders collectively own about 24.21% of the company's total shares. Fidelity Management & Research Company LLC., and The Vanguard Group, Inc hold maximum stakes of 7.05% and 3.55 %, respectively.
Stock Information
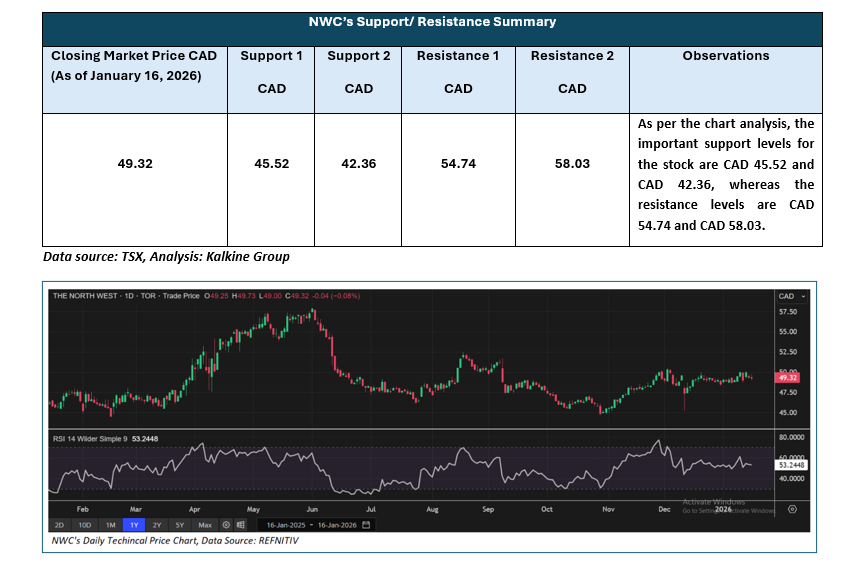
NWC gained 4.27% over six months while increasing 8.04% year-on-year. The stock recorded a 52-week high of CAD 57.95 on June 2, 2025, and a 52-week low of CAD 44.48 on February 18, 2025.
Note 1: Past performance is not a reliable indicator of future performance.
Note 2: The reference date for all price data, currency, technical indicators, support, and resistance levels is January 16, 2026. The reference data in this report has been partly sourced from EODHD/Others.
Technical Indicators Defined: -
Support: A level at which the stock prices tend to find support if they are falling, and a downtrend may take a pause backed by demand or buying interest. Support 1 refers to the nearby support level for the stock and if the price breaches the level, then Support 2 may act as the crucial support level for the stock.
Resistance: A level at which the stock prices tend to find resistance when they are rising, and an uptrend may take a pause due to profit booking or selling interest. Resistance 1 refers to the nearby resistance level for the stock and if the price surpasses the level, then Resistance 2 may act as the crucial resistance level for the stock.


 Please wait processing your request...