Image source: Shutterstock
Highlights
- Ovintiv reported FY24 net revenue of USD 9,152 million, down 15.9% year-over-year due to weaker commodity prices
- Net earnings for FY24 fell 46.0% YoY to USD 1,125 million despite partial offset from other income sources
- In 2025, Ovintiv expects average total production between 595,000 and 615,000 BOE/d, indicating stable output
Ovintiv Inc. (TSX:OVV) is a leading energy producer engaged in oil and natural gas exploration and production. With presence across multiple top-tier basins in the U.S. and Canada, the company also markets oil, natural gas, and NGLs as part of its integrated operations.
In the financial year 2024 (FY24), Ovintiv reported a net revenue of USD 9,152 million, marking a 15.9% decline from USD 10,883 million in FY23. This drop was primarily driven by significantly lower realization prices for crude and Natural Gas Liquids (NGL).
Operating income followed the same trend, falling 44.9% year-over-year to USD 1,579 million, largely due to the revenue decline and impairment-related costs.
Earnings before income tax dropped to USD 1,351 million from USD 2,510 million, reflecting a 46.2% YoY decrease. Although partially cushioned by other income, the overall contraction in operational profitability led to a 46.0% decline in net earnings, which stood at USD 1,125 million for the year.
Recent Business Update
Recently, the company announced that it will report its second quarter 2022 financial results after market close on Wednesday, July 27, 2022.
Company Outlook
For 2025, the company anticipates full-year average total production volumes to range between approximately 595,000 and 615,000 barrels of oil equivalent per day (MBOE/d). This includes expected oil and plant condensate production of around 202,000 to 208,000 barrels per day (Mbbls/d), other NGLs production of approximately 87,000 to 92,000 barrels per day, and natural gas production volumes projected between 1,825 and 1,875 million cubic feet per day (MMcf/d).
Top 10 Shareholders
The top 10 shareholders of OVV together own about 44.60% of the company’s total shares. The Vanguard Group, Inc. is the largest shareholder with a stake of approximately 11.27%. BlackRock Institutional Trust Company, N.A. follows closely with around 9.46% ownership.
Stock Information
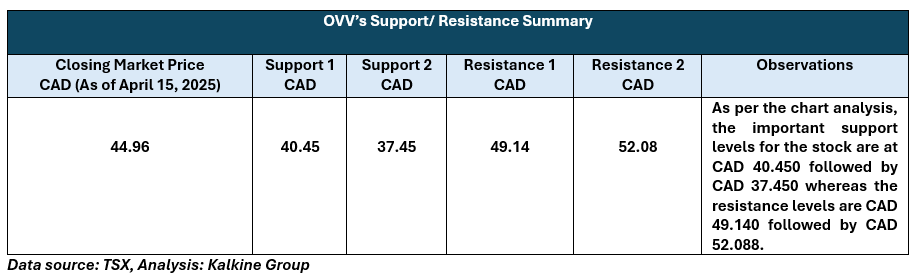
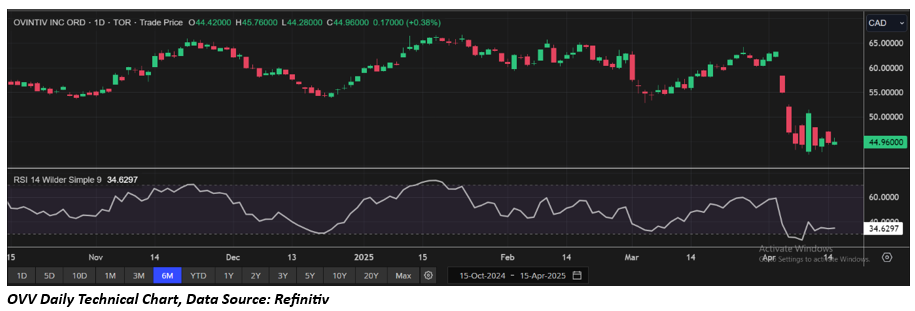
Over the past week, the stock has gained approximately 1.17%, however, it has declined by around 22.77% over the past month. As of April 15, 2025, it is trading below the average of its 52-week high of CAD 74.50 and 52-week low of CAD 42.35, with a closing price of CAD 44.96.
Note 1: Past performance is not a reliable indicator of future performance.
Note 2: The reference data for all price data, currency, technical indicators, support, and resistance levels is April 15 2025. The reference data in this report has been partly sourced from EODHD/Others.
Technical Indicators Defined
Support: A level at which the stock prices tend to find support if they are falling, and a downtrend may take a pause backed by demand or buying interest. Support 1 refers to the nearby support level for the stock and if the price breaches the level, then Support 2 may act as the crucial support level for the stock.
Resistance: A level at which the stock prices tend to find resistance when they are rising, and an uptrend may take a pause due to profit booking or selling interest. Resistance 1 refers to the nearby resistance level for the stock and if the price surpasses the level, then Resistance 2 may act as the crucial resistance level for the stock.


 Please wait processing your request...