_07_22_2025_03_10_16_030086.jpg)
Image source: © 2025 Krish Capital Pty.Ltd
Highlights
- RBA reported a 4.1% YoY revenue increase to USD 1,108.6 million in Q1FY25.
- RBA saw net income rise 5.5% YoY to USD 113.3 million, reflecting improved profitability.
- RBA recorded a 25.6% YoY increase in net cash from operating activities to USD 156.8 million.
RB Global Incorporation (TSX: RBA) is a global marketplace for heavy equipment, conducting 300+ live and online auctions annually across 12+ countries through platforms like IronPlanet, Marketplace-E, and GovPlanet, selling USD 5 billion+ in construction, agricultural, oilfield, and transportation assets.
In the first quarter of the financial year 2025 (Q1FY25), the company’s total revenue increased by 4.1% YoY to USD 1,108.6 million due to steady demand and resilience across its business segments, supporting top-line momentum despite market pressures. The operating income dropped by 4.7% YoY to USD 189.5 million due to short-term cost pressure, but management’s focus on expense control aims to restore margin strength. The net income surged by 5.5% YoY to USD 113.3 million, driven by financial management and improved profitability, reinforcing confidence in the company’s earnings quality. The net cash provided by operating activities rose by 25.6% YoY to USD 156.8 million, up from USD 124.8 million in Q1FY24.
In Q1 2025, the company reported a mixed set of financial indicators, showcasing both strengths and weaknesses. On the positive side, the pretax margin rose to 12.9%, significantly outperforming the industry median of 5.6%. Similarly, the net margin stood at 10.2%, more than double the industry median of 4.1%, indicating improved profitability and operational efficiency. However, these gains were offset by certain margin pressures. The gross margin declined to 46.2%, from 48.4% in Q1 2024, while the EBITDA margin also slipped to 31.8% from 33.7% over the same period, signaling increased cost pressures or a shift in revenue mix.
Stock Information
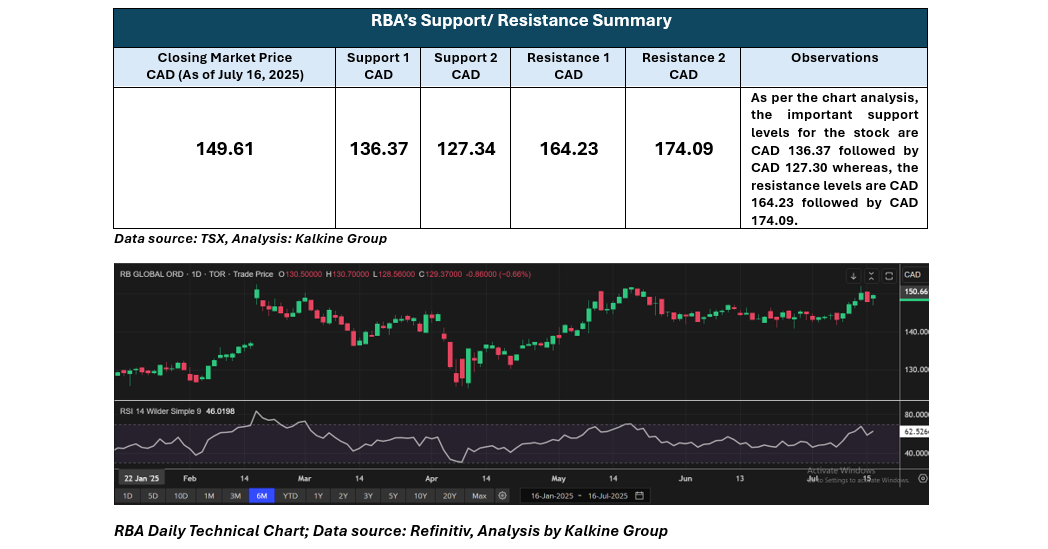
The stock has gained approximately 3.26% over the past week and around 3.24% over the past month. As of July 16, 2025, it closed at CAD 149.61, trading above the average 52-week low of CAD 99.09 and 52-week high of CAD 152.48.
Note 1: Past performance is not a reliable indicator of future performance.
Note 2: The reference data for all price data, currency, technical indicators, support, and resistance levels Is 16 July 2025. The reference data in this report has been partly sourced from EODHD/Others.
Technical Indicators Defined
Support: A level at which the stock prices tend to find support if they are falling, and a downtrend may take a pause backed by demand or buying interest. Support 1 refers to the nearby support level for the stock and if the price breaches the level, then Support 2 may act as the crucial support level for the stock.
Resistance: A level at which the stock prices tend to find resistance when they are rising, and an uptrend may take a pause due to profit booking or selling interest. Resistance 1 refers to the nearby resistance level for the stock and if the price surpasses the level, then Resistance 2 may act as the crucial resistance level for the stock.


 Please wait processing your request...