Highlights
-
FY23 showcased impressive metrics for SOIL, including a 288.5% YoY increase in net earnings and a 159% surge in net revenue, backed by a robust net margin of 46.5%.
-
The share price of SOIL has surged by 26% and 16.03% over the last one week and one month, respectively.
-
SOIL achieved its third consecutive year of growth in production during FY23 with an uptick of 153% in average production per day.
Saturn Oil & Gas Inc. (TSX: SOIL) is a resource company based in Canada. The company’s focus is to develop the exploration of its oil and gas properties in west-central and Southeast Saskatchewan. Its business activities include acquisition, exploration, and development of petroleum and natural gas resource deposits in Canada.
In FY23, SOIL reported a net margin of 46.5% versus industry median of 18.3%. Further, 2023 marked the company’s third consecutive year of growth in production where it witnessed a 153% increment in average daily production.
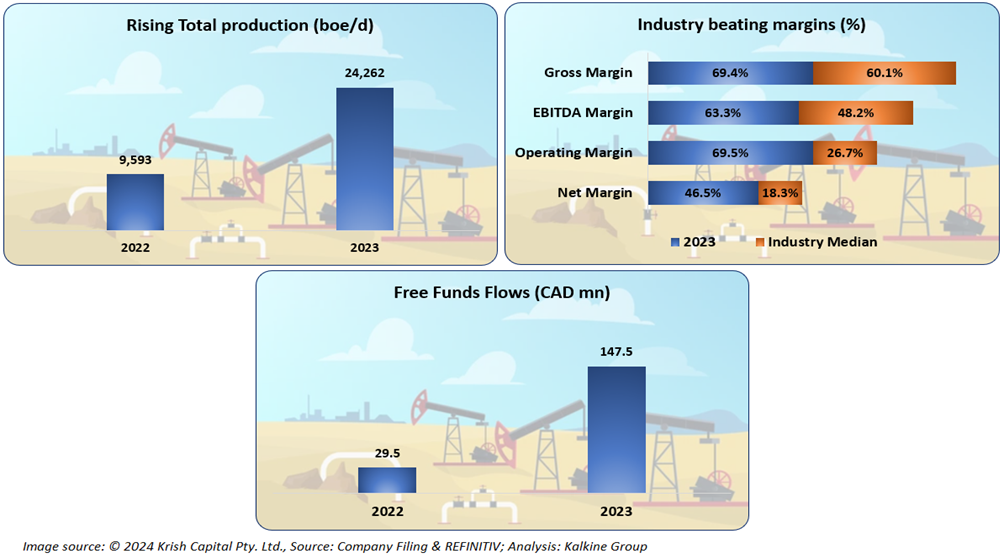
In FY23, the company witnessed a year on year (YoY) increment of 288.5% in net earnings and 159% surge in net revenue.
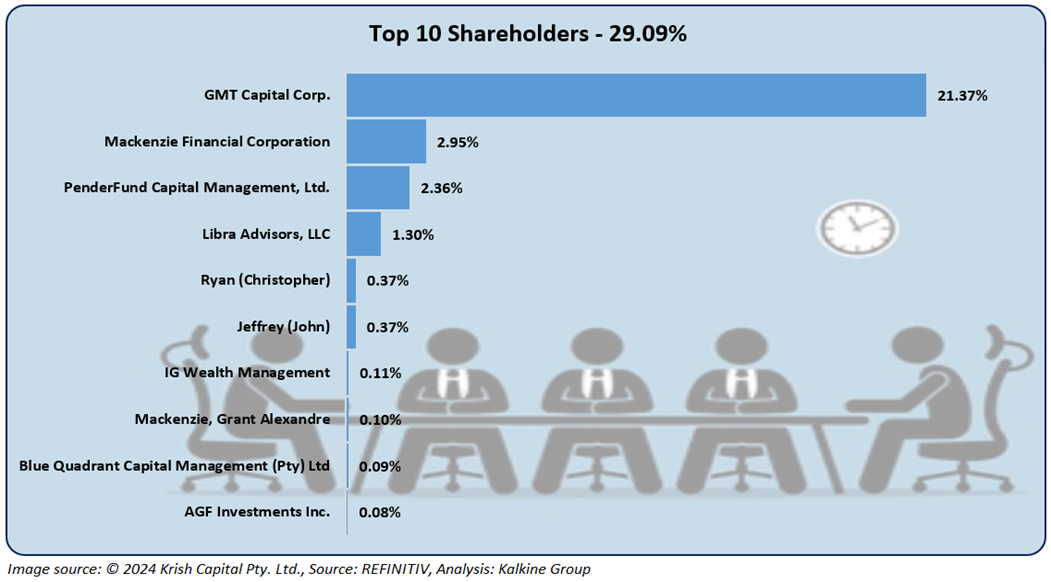
Top 10 shareholders
Nearly 29.09% of the total shareholding of SOIL is owned by the top 10 shareholders. GMT Capital Corp. and Mackenzie Financial Corporation hold maximum stake in the company at ~21.37% and ~2.95%, respectively as depicted by the picture below:
Company outlook
Moving ahead in FY2024, the company aims to have an average production (BOE/d) in a range of 26,500-27,500. It is also expecting to clock free funds flows in a range of CAD 1444 million- CAD 160 million.
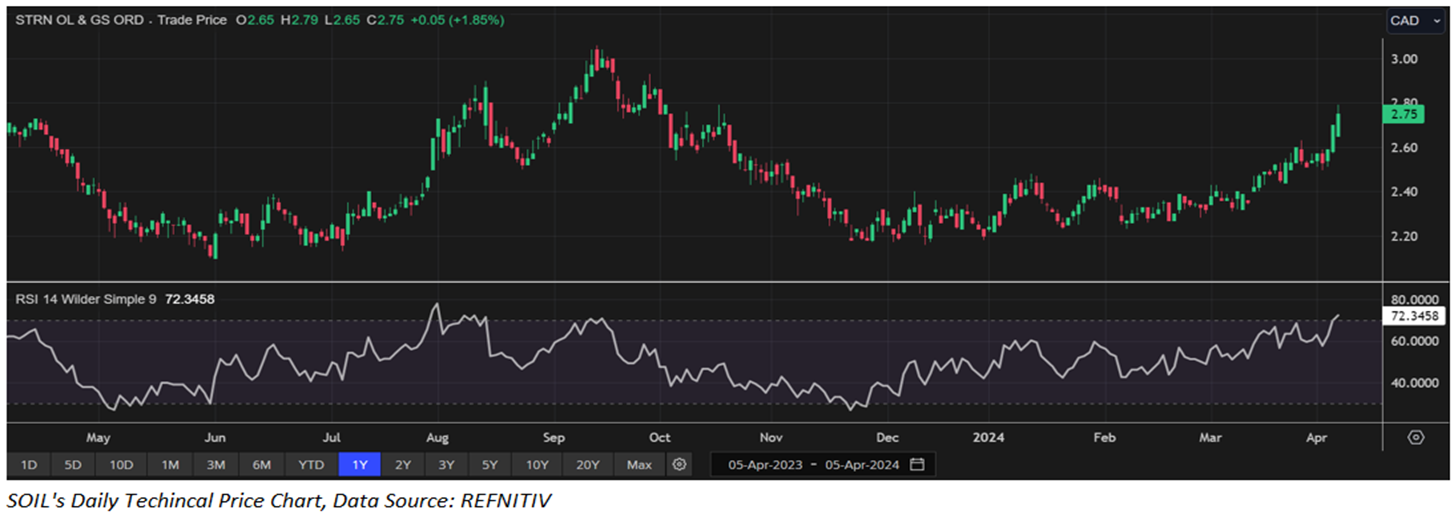
Price performance
The share price of SOIL has mounted by ~8.26% and ~16.03% over the last one week and one month, respectively. Moreover, the stock is trading above the average of its 52-week high price of CAD 3.06 and 52-week low price of CAD 2.10. The company’s market capitalisation stands at CAD 383.11 million.
Note 1: Past performance is not a reliable indicator of future performance.
Note 2: The reference data for all price data, currency, technical indicators, support, and resistance levels is 05 April 2024. The reference data in this report has been partly sourced from EODHD/Others.


 Please wait processing your request...