_07_24_2023_12_29_37_862450_04_12_2024_06_10_54_664335.jpg)
Image source: Shutterstock
Highlights
Stelco Holdings Inc. (TSX: STLC) has more than a century of experience in building superior quality steel products. Based in Canada, the company has diversified customer base across North America.
One of the key positive aspects of the company it its higher Return on Equity, which was 11.0% in FY23 compared to an industry median of 4.2%. Entering Q1 2024, the company expects shipping volumes to rebound to approximately 625 thousand to 675 thousand net tons, alongside enhanced adjusted EBITDA driven by improved pricing conditions observed. The group is planning to optimise production by utilising previously underexploited processes. It is continuously pursuing initiatives to improve asset use with minimal investment. It is also investigating ways to generate revenue from by-products. Recently, the company paid a quarterly dividend of CAD 0.50 per share (7 March 2024). As of 08 April 2024, the company’s dividend yield stood at 4.60%.
Key metrics
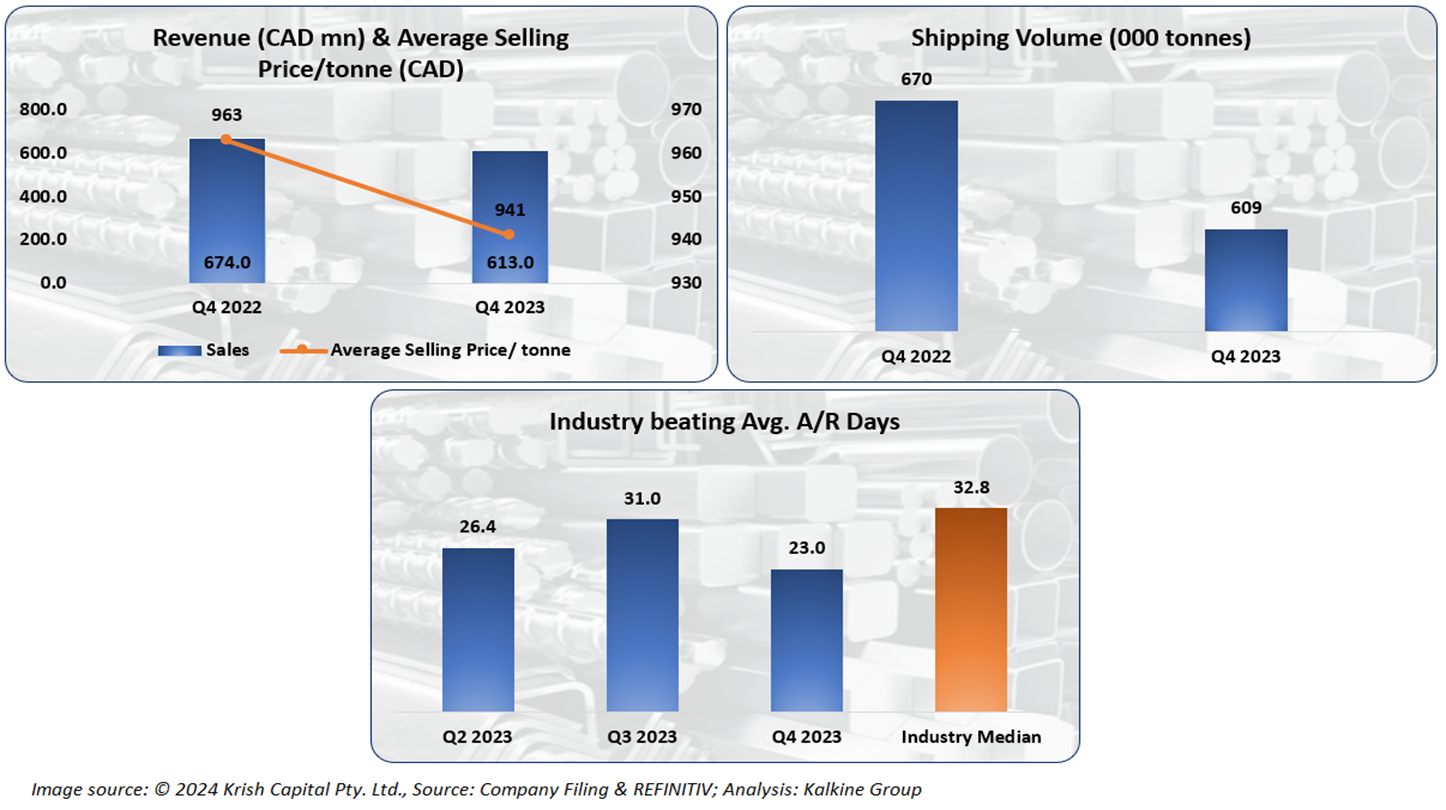
Due to decline in volume and average selling price per tonne, the company clocked lower sales in Q4 2023 compared to 2023. On the bright side, it demonstrated its resilience and adaptability by performing better than the industry median in terms of average accounts receivable days.
The company is majorly exposed to risks such as fluctuations in prices of raw materials, scarcity of the product demand, and inflationary pressures.
Top 10 shareholders
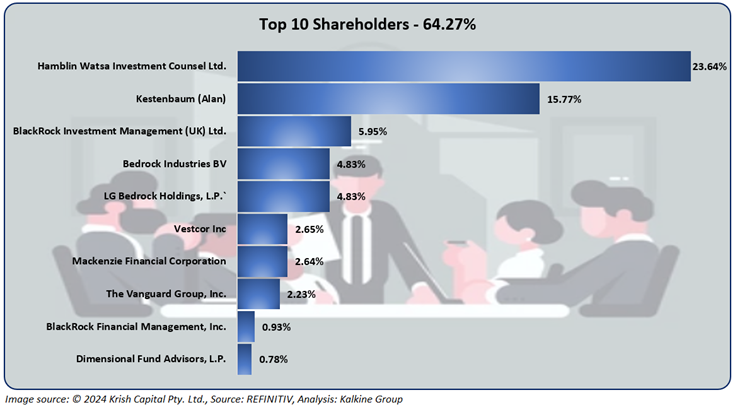
The combined ownership of the top 10 shareholders in the company is 64.27%. Hamblin Watsa Investment Counsel Ltd. and Kestenbaum (Alan) hold the largest stakes in the company, at approximately 23.64% and 15.77%, respectively.
Stock price performance
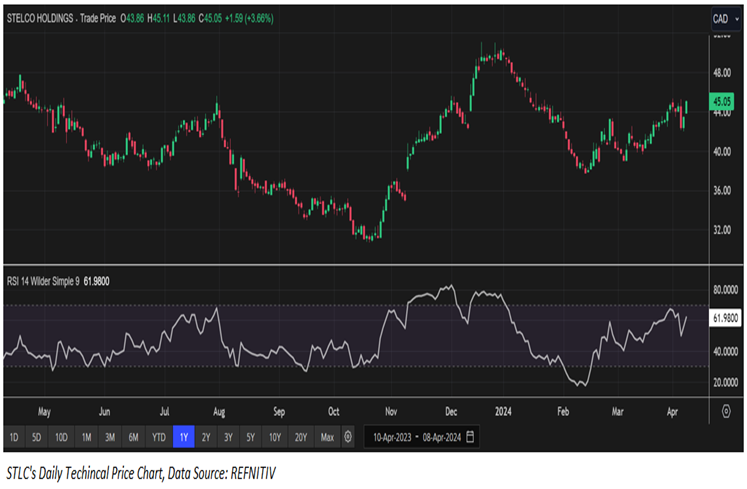
The stock has witnessed an uptick of ~9.07% over the last 1 month. Furthermore, the stock is currently trading higher than the average 52-week high of CAD 51.24 and low of CAD 32.925.
Note 1: Past performance is not a reliable indicator of future performance.
Note 2: The reference date for all price data, currency, technical indicators, support, and resistance levels is April 8, 2024. The reference data in this report has been partly sourced from EODHD/Others.


 Please wait processing your request...