
Highlights
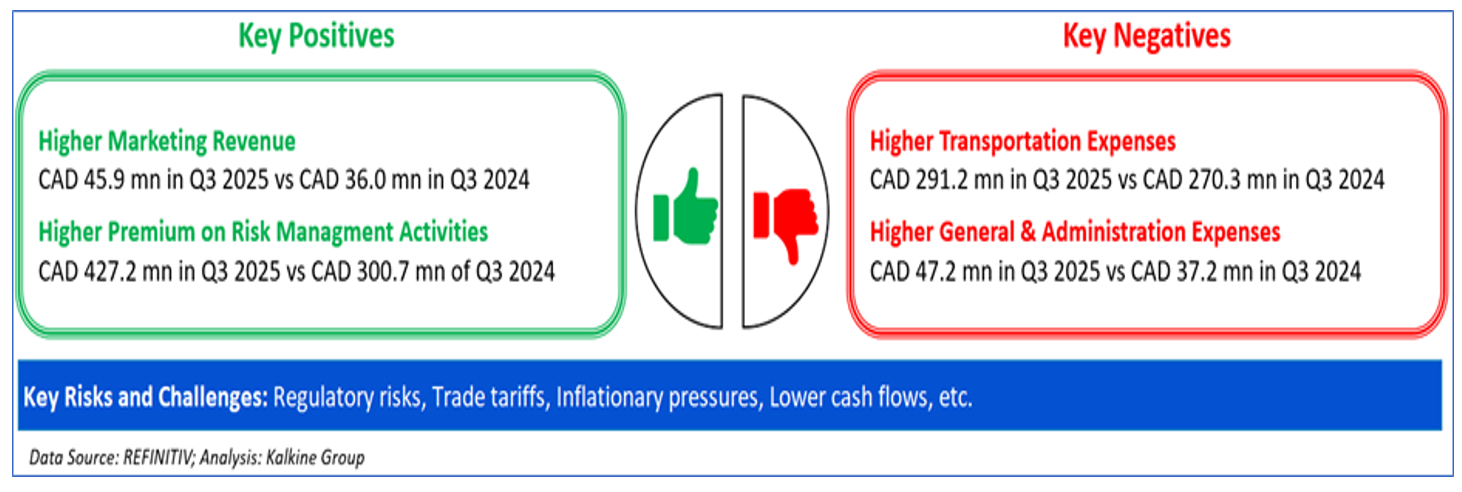
- Tourmaline Oil reported Q3 2025 commodity sales of CAD 925 million, down 1.1% year-on-year.
- Operating income fell 43% YoY to CAD 282 million, reflecting lower margins amid price volatility.
- The company declared a special dividend of CAD 0.25 per share and maintained its base dividend at CAD 0.50.
- Tourmaline targets free cash flow of CAD 2.5–3.0 billion annually by the early next decade, supported by LNG-linked growth.
Tourmaline Oil Corp (TSX:TOU) is a Canada-based energy company focused on the acquisition, exploration, development, and production of natural gas and crude oil within the Western Canada Sedimentary Basin.
The company delivered steady commodity sales from production in third quarter of 2025 (Q3 2025), reaching CAD 925 million, only a slight decrease of 1.1% year-on-year. Despite challenging market conditions and softer pricing, the company maintained production levels. Income from operations dropped by 43% YoY to CAD 282 million, and income before taxes was down 45.4% to CAD 254.4 million, indicating margin pressure and volatile pricing dynamics. However, total cash flow from operating activities surged 17.4% YoY to CAD 853.5 million.
Recent Business Update
On November 5, 2025, Tourmaline announced a special dividend of CAD 0.25 per share and maintained its quarterly base dividend at CAD 0.50 per share.
Company Outlook
Tourmaline looks forward to a better second half of 2025 and beyond, supported by improving commodity prices, LNG Canada’s start-up, and steady production growth from its high-margin gas and liquids segment.
The company aims for higher free cash flow in H2 2025 as deferred exploration and production activities resume. With a disciplined capital budget of CAD 2.6–2.85 billion and low leverage (0.5x debt-to-cash flow), Tourmaline benefits from strategic LNG exposure. The NEBC Montney development is expected to drive production growth to 850,000 boepd by early next decade, supporting annual free cash flow of CAD 2.5–3.0 billion.
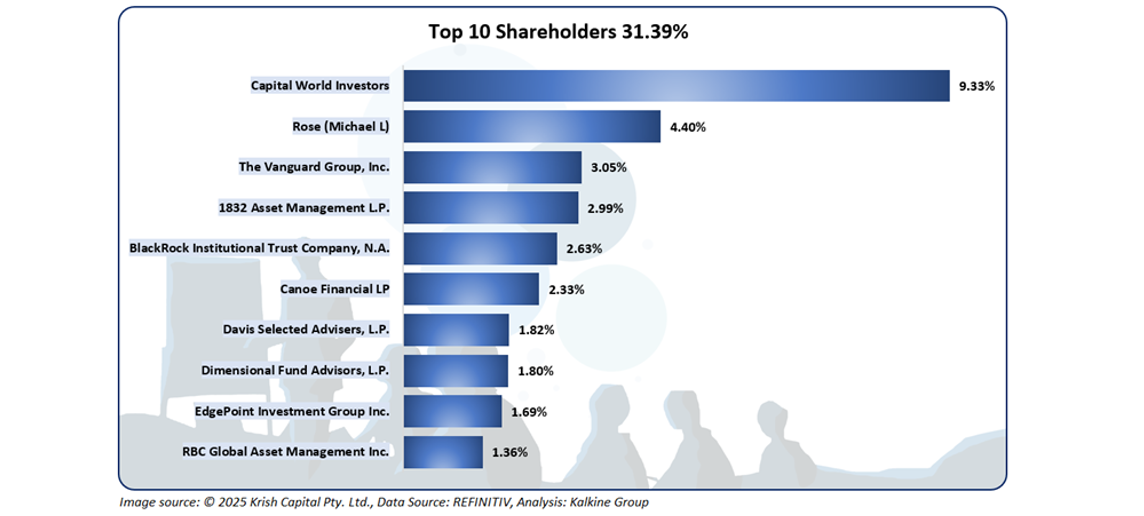
Top 10 Shareholders
The top ten shareholders collectively account for about 31.39% of the total equity. Capital World Investors holds the largest stake at roughly 9.33%, followed by Michael L. Rose with around 4.40%.
Stock Information
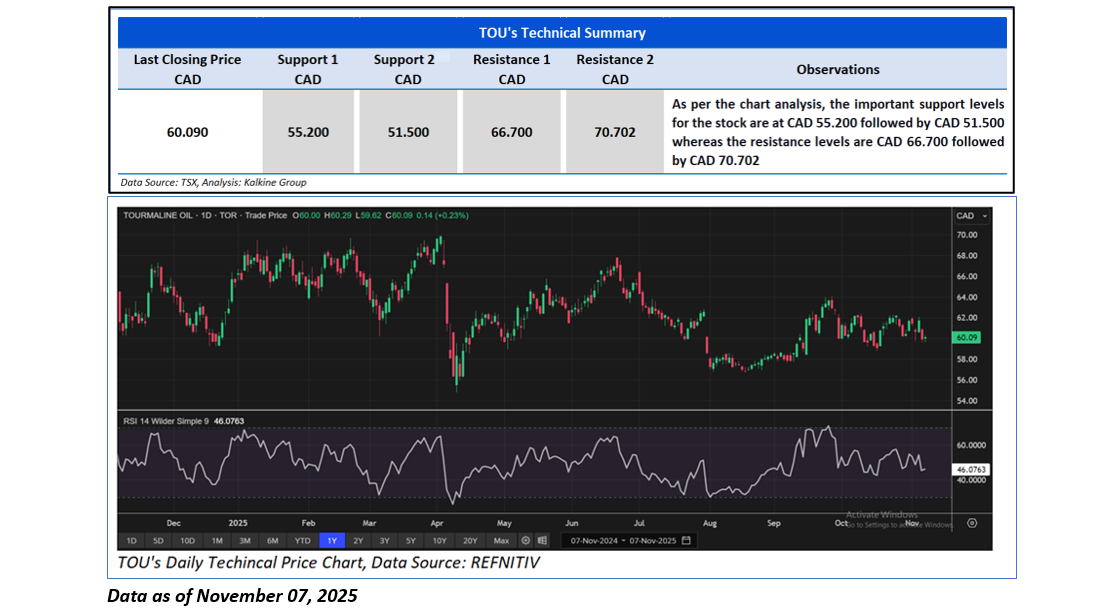
The stock has declined by approximately 2.24% over the past week but gained around 3.72% in the last three months. It currently trades below its 52-week high of CAD 70.83 and above its 52-week low of CAD 55.40.
Note 1: Past performance is not a reliable indicator of future performance.
Note 2: The reference data for all price data, currency, technical indicators, support, and resistance levels is 07 November 2025. The reference data in this report has been partly sourced from EODHD/Others.
Technical Indicators Defined
Support: A level at which the stock prices tend to find support if they are falling, and a downtrend may take a pause backed by demand or buying interest. Support 1 refers to the nearby support level for the stock and if the price breaches the level, then Support 2 may act as the crucial support level for the stock.
Resistance: A level at which the stock prices tend to find resistance when they are rising, and an uptrend may take a pause due to profit booking or selling interest. Resistance 1 refers to the nearby resistance level for the stock and if the price surpasses the level, then Resistance 2 may act as the crucial resistance level for the stock.


 Please wait processing your request...