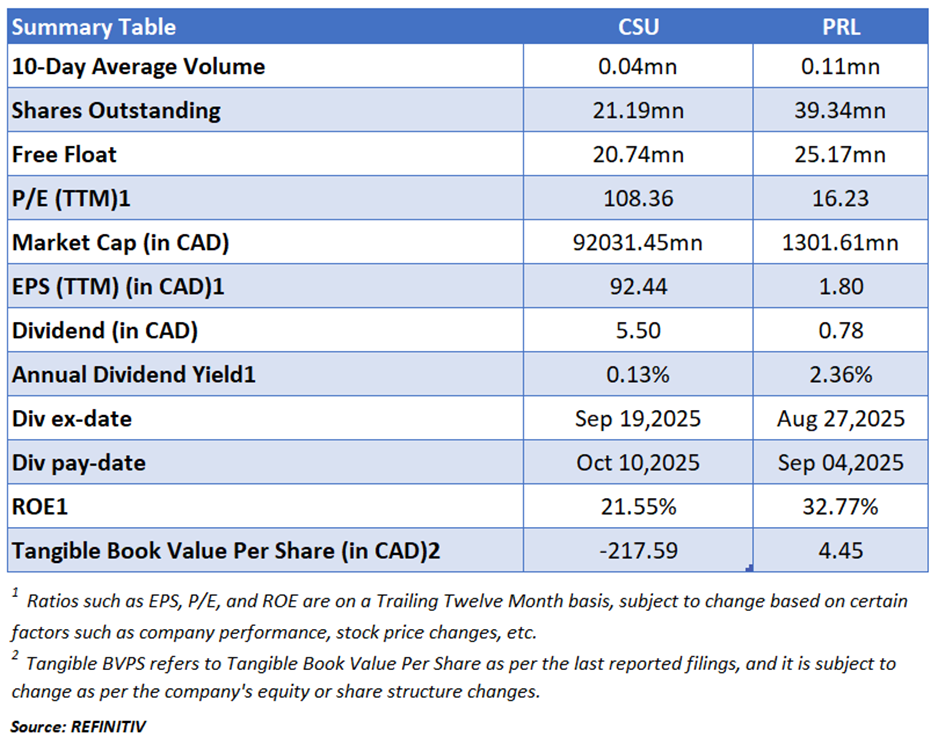
Constellation Software Inc.
Section1: Company Overview

Constellation Software Inc. (TSX: CSU) is a Canada-based company that develops and customizes software for public- and private-sector markets. The firm acquires, manages, and builds vertical-specific businesses. Its operations are organized in two segments: Public Sector and Private Sector. The portfolio companies serve various markets including communications, credit unions, beverage distribution, tour operators, auto clubs, textiles and apparel, hospitality, and community care. The firm has operations in North America, Europe, Australia, South America, and Africa.
This Artificial Intelligence and Emerging Technologies report covers the Investment Highlights, Key Financial Metrics, Risks, Technical Analysis along with the Valuation, Target Price, and Recommendation on the stock.

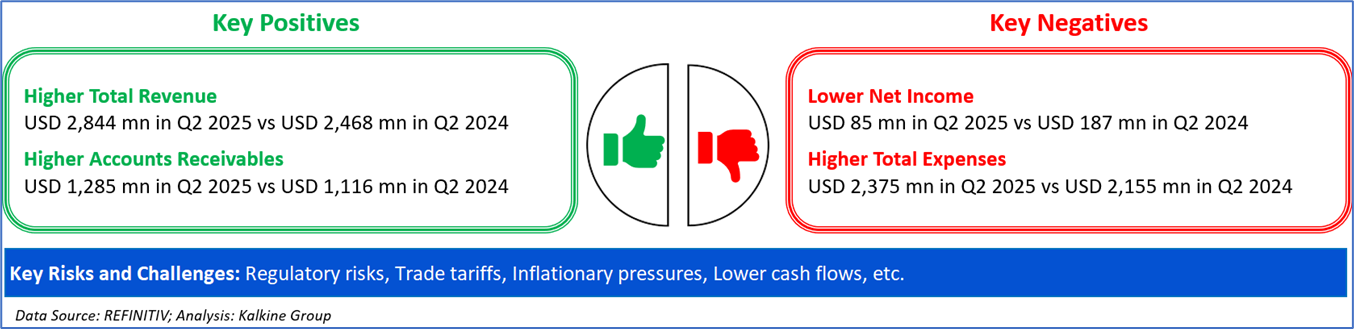
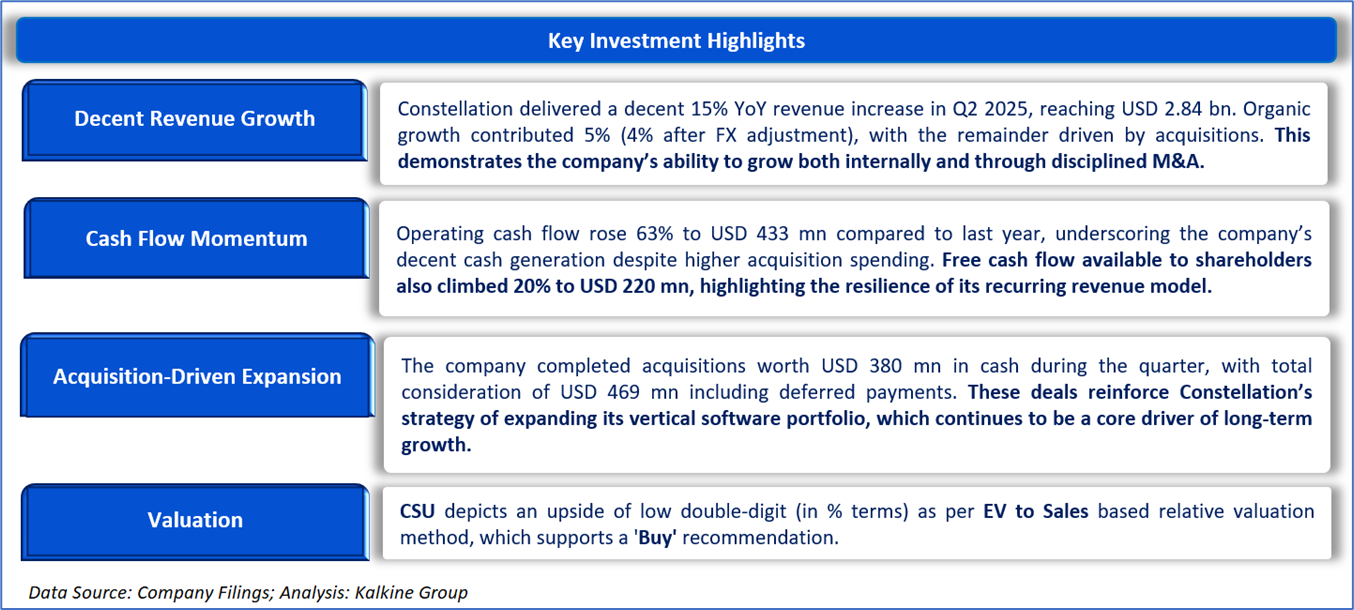
Section2: Financial Highlights

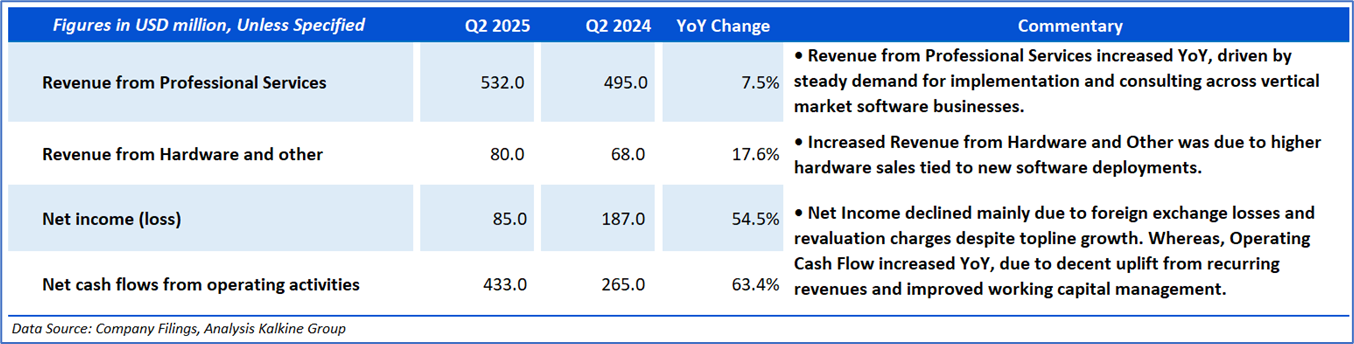
Section 3: Key Metrics
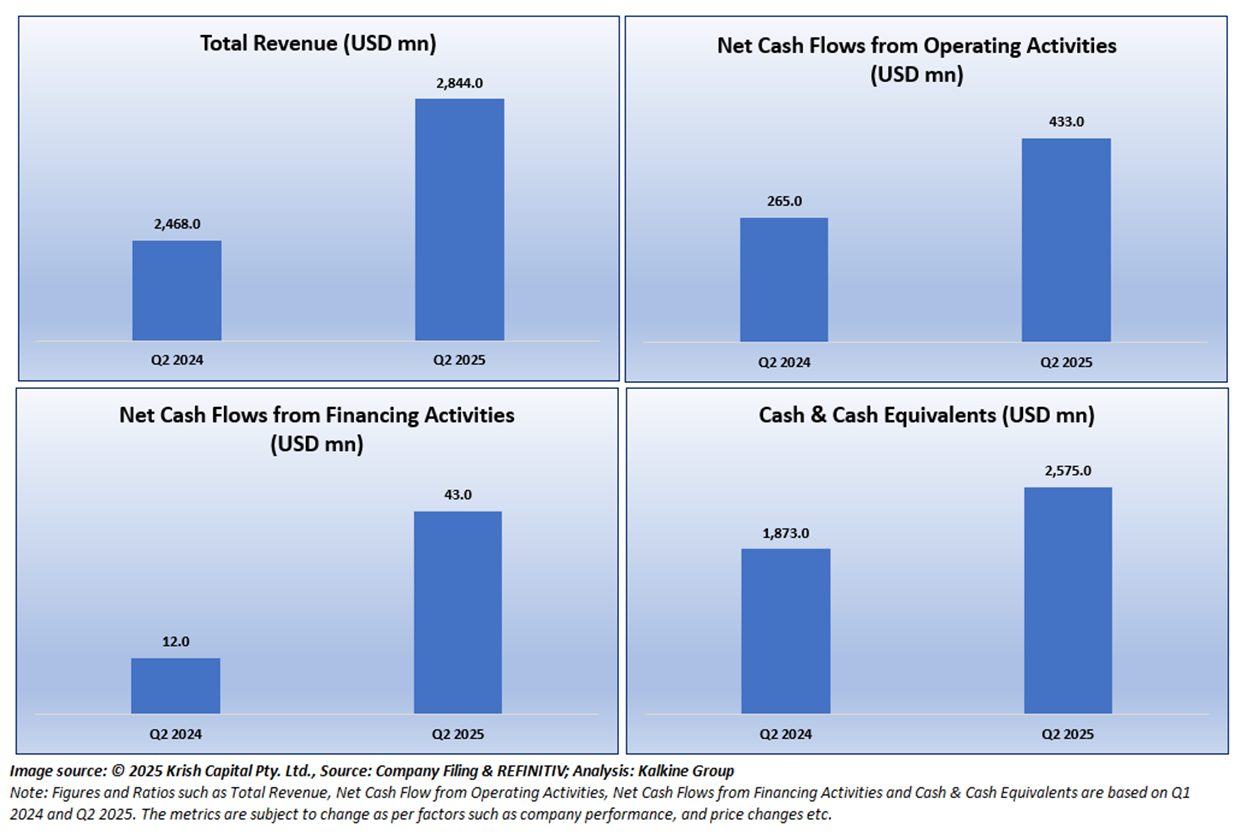
Below charts depict the change in Total Revenue, Net Cash Flow from Operating Activities, Net Cash Flows from Financing Activities and Cash & Cash Equivalents of the Company for Q2 2024 and Q2 2025.
Section 4: Stock Recommendation Summary

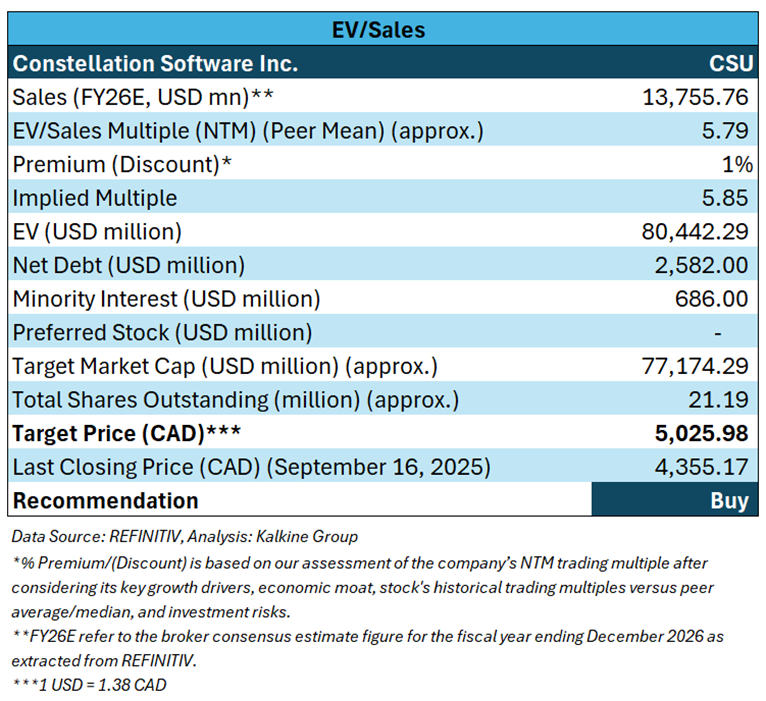
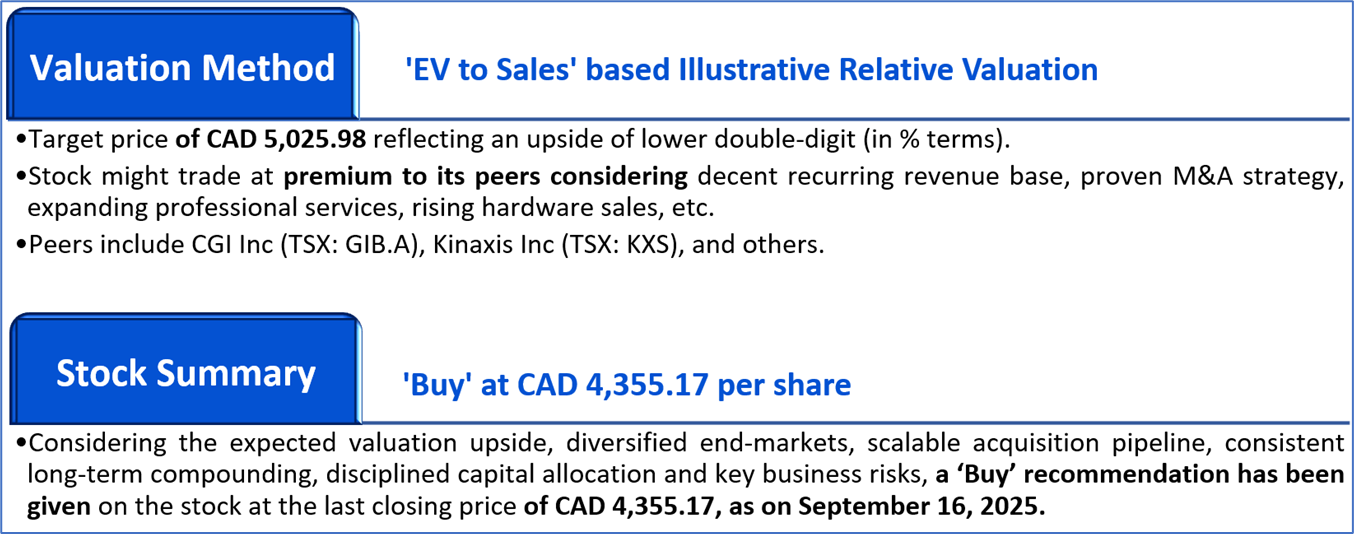
Valuation Methodology: EV to Sales Multiple Based Relative Valuation (Illustrative):


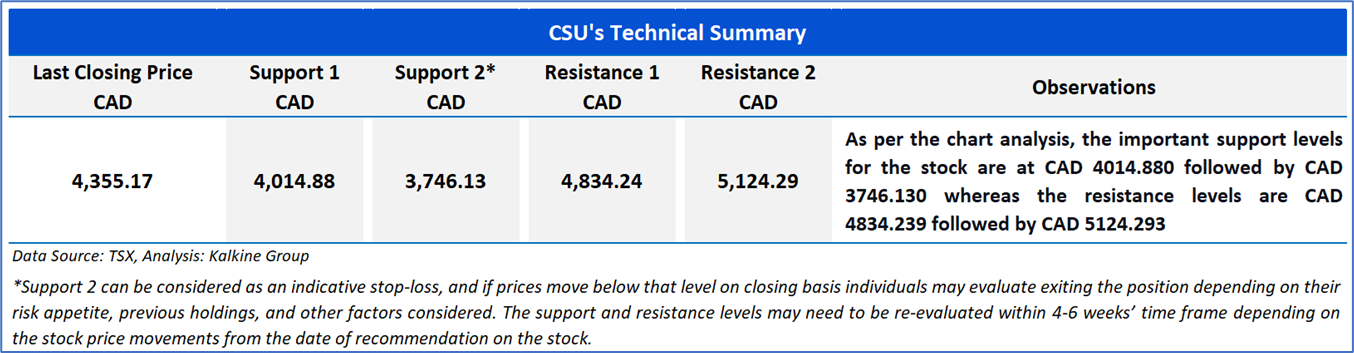
The stock has witnessed a downside of ~4.95% and ~9.88% over the last 1 week and 3 months respectively. Moreover, it is trading below the average 52-week high price of CAD 5,300.00 and 52-week low price of CAD 4,101.70, providing an opportunity to accumulate the stock.

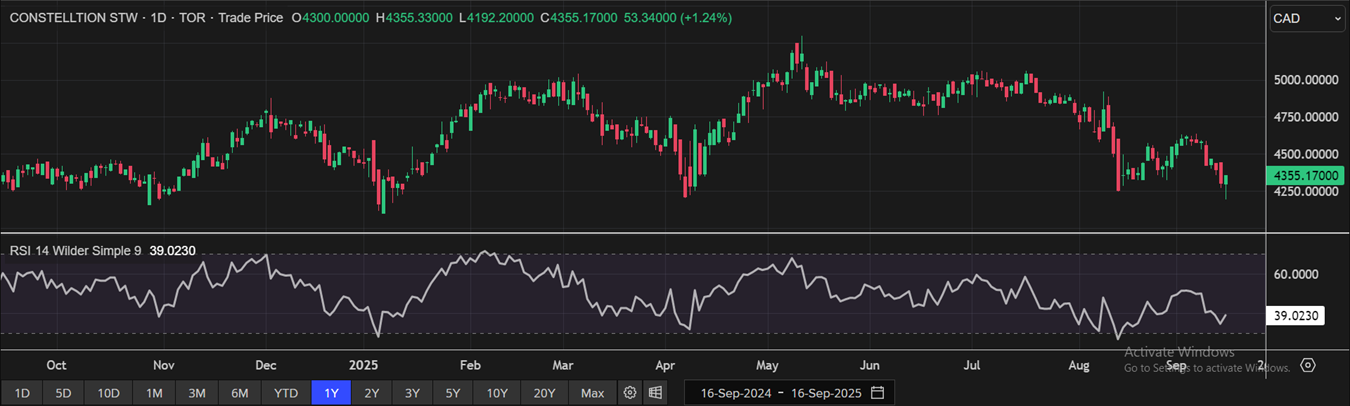
One-Year Technical Price Chart (as of September 16, 2025). Source: REFINITIV, Analysis: Kalkine Group

Propel Holdings Inc.
Section1: Company Overview

Propel Holdings Inc. (TSX: PRL) is a financial technology company committed to credit inclusion and helping underserved consumers by providing fair, fast, and transparent access to credit. It operates through its two brands: MoneyKey and CreditFresh. The company, through its MoneyKey brand, is a state-licensed direct lender and offers either Installment Loans or Lines of Credit to new customers in several US states. Through its CreditFresh brand, the company operates as a bank servicer that provides marketing, technology, and loan servicing services to unaffiliated, FDIC insured, state-chartered banks in the US (Bank Program). It primarily operates in Canada.
This “Artificial Intelligence and Emerging Technologies” report covers the Investment Highlights, Key Financial Metrics, Risks, Technical Analysis along with the Valuation, Target Price, and Recommendation on the stock.

Section2: Financial Highlights

Section 3: Key Metrics
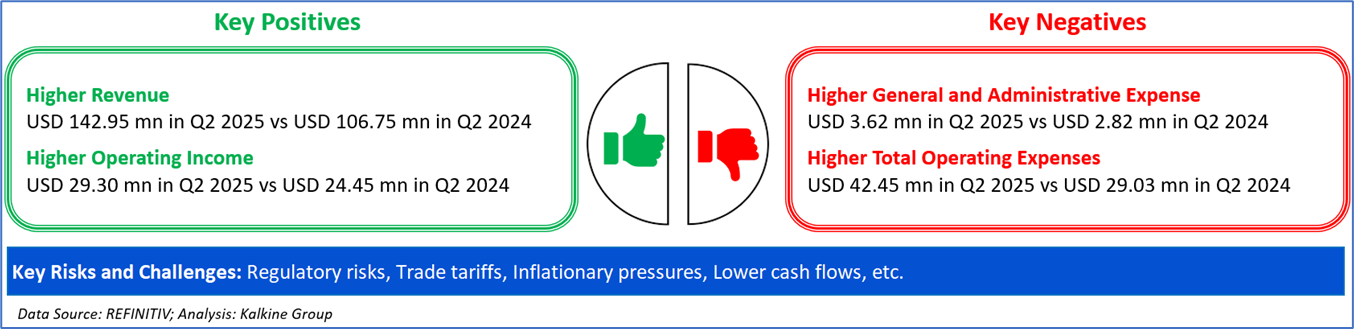
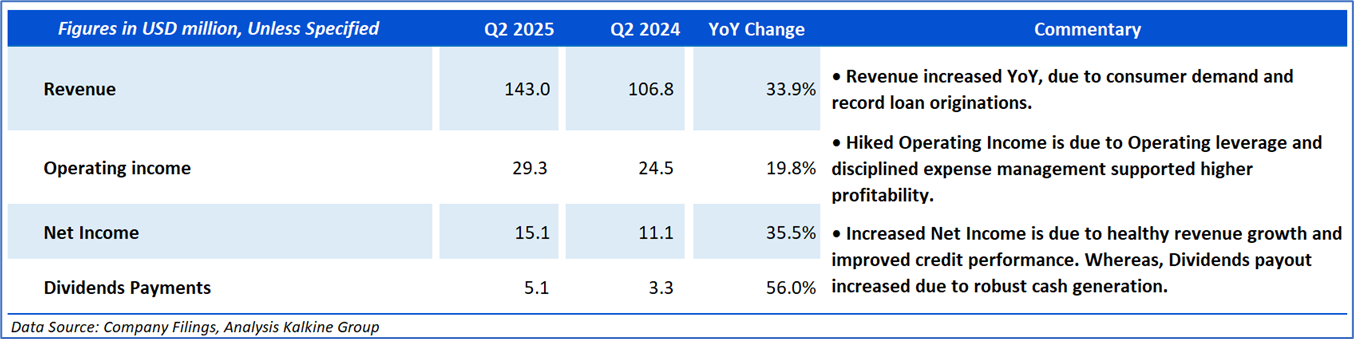
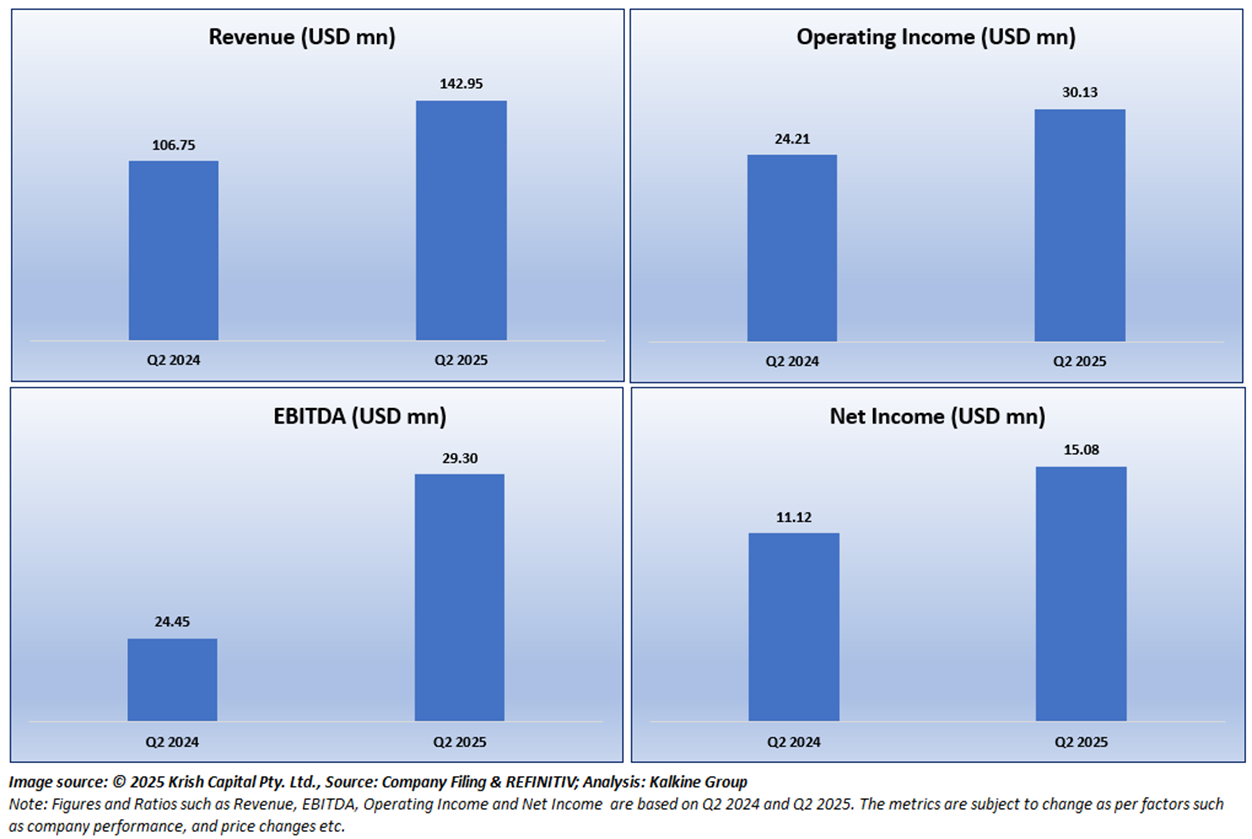
Below charts depict the change in Revenue, EBITDA, Operating Income and Net Income of the Company for Q2 2024 and Q2 2025.
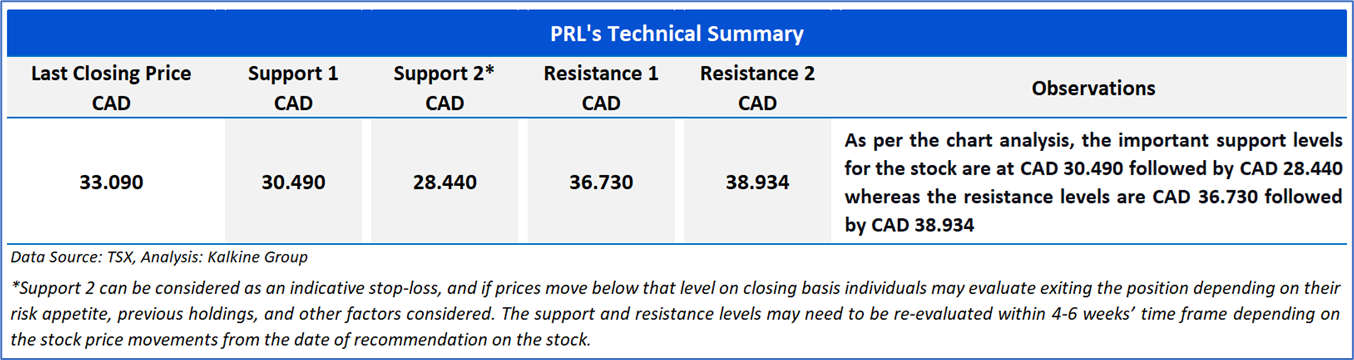
Section 4: Stock Recommendation Summary

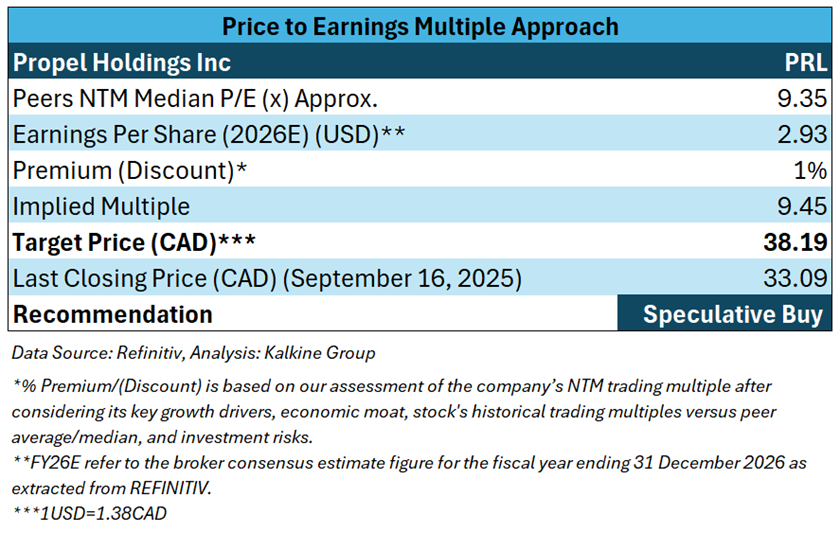
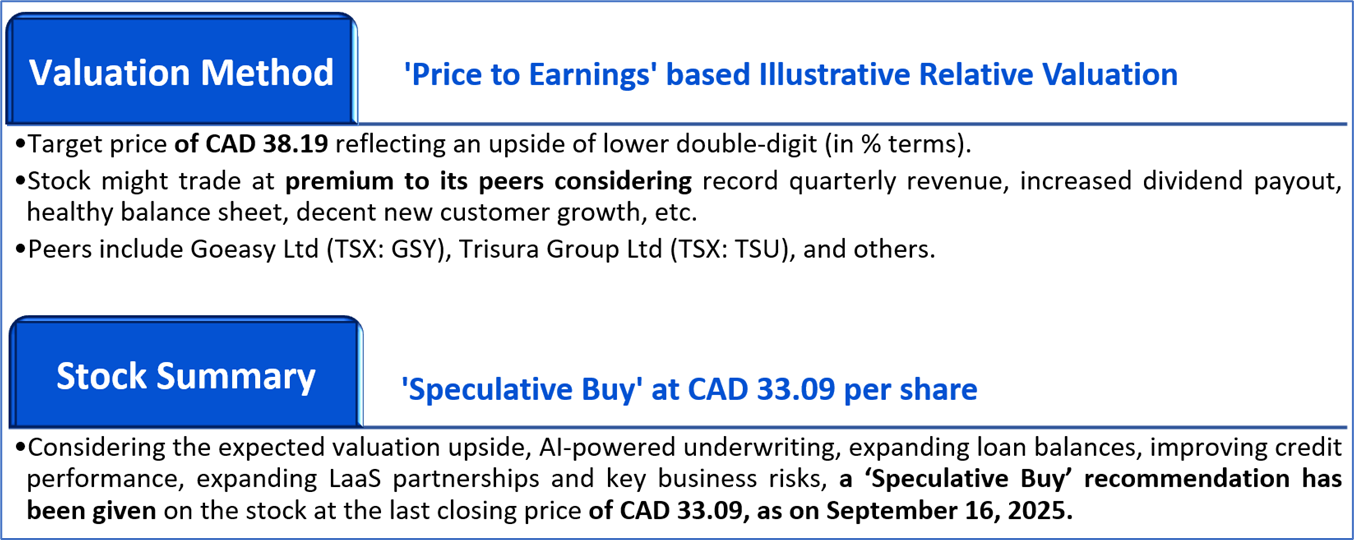
Valuation Methodology: Price to Earnings Multiple Based Relative Valuation (Illustrative):


The stock has witnessed an upside of ~2.19% and downside ~1.25% over the last 1 week and 3 months respectively. Moreover, it is trading above the average 52-week high price of CAD 43.36 and 52-week low price of CAD 20.99, providing an opportunity to ride the trend.

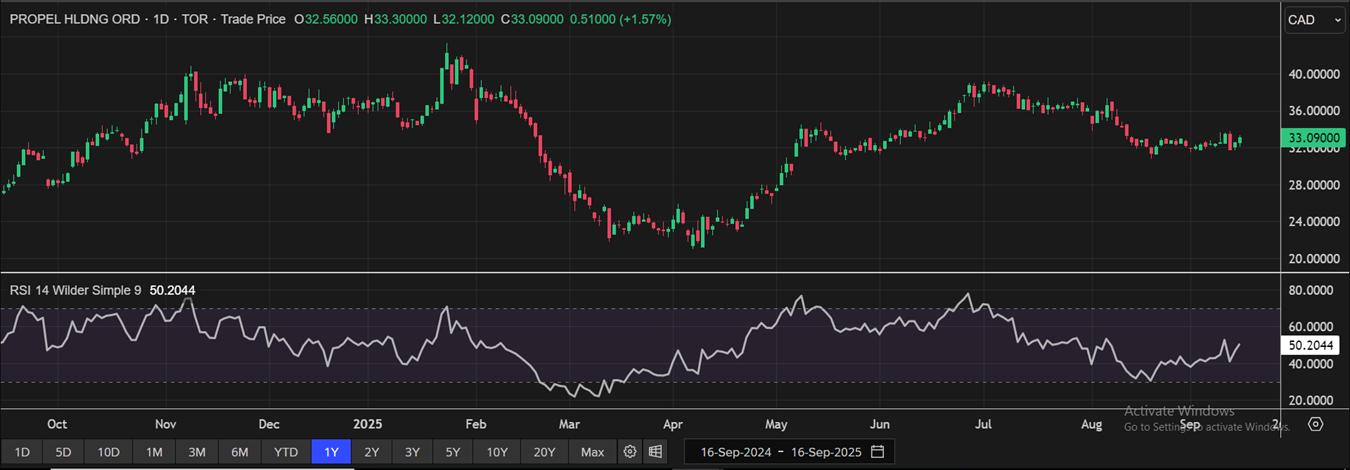
One-Year Technical Price Chart (as of September 16, 2025). Source: REFINITIV, Analysis: Kalkine Group

Markets are trading in a highly volatile zone currently due to certain macroeconomic issues and geopolitical tensions prevailing. Therefore, it is prudent to follow a cautious approach while investing.
Note 1: Past performance is not a reliable indicator of future performance.
Note 2: The reference date for all price data, and currency as of September 16, 2025. The reference data in this report has been partly sourced from REFINITIV.
Note 3: Investment decisions should be made depending on an individual's appetite for upside potential, risks, holding duration, and any previous holdings. An 'Exit' from the stock can be considered if the Target Price mentioned as per the Valuation and or the technical levels provided has been achieved and is subject to the factors discussed above.
Note 4: Dividend Yield may vary as per the stock price movement.
Note 5: Kalkine reports are prepared based on the stock prices captured either from REFINITIV or Trading View. Typically, REFINITIV or Trading View may reflect stock prices with a delay which could be a lag of 25-30 minutes. There can be no assurance that future results or events will be consistent with the information provided in the report. The information is subject to change without any prior notice.
Technical Indicators Defined: -
Support: A level at which the stock prices tend to find support if they are falling, and a downtrend may take a pause backed by demand or buying interest.
Resistance: A level at which the stock prices tend to find resistance when they are rising, and the uptrend may take a pause due to profit booking or selling interest.
Stop-loss: In general, it is a level to protect further losses in case of any unfavourable movement in the stock prices.
Past performance is not a reliable indicator of future performance.
 Please wait processing your request...