Section 1: Company Overview and Fundamentals
Company Overview:
dLocal Limited (NASDAQ: DLO) is a technology-driven payments platform specializing in cross-border transactions, enabling global merchants to process payments seamlessly in emerging markets. The company leverages its robust infrastructure to deliver innovative payment solutions across Latin America, Africa, and Asia.
Kalkine’s American Tech Report covers the Company Overview, Key positives & negatives, Investment summary, Key investment metrics, Top 10 shareholding, Business updates and insights into company recent financial results, Key Risks & Outlook, Price performance and technical summary, Target Price, and Recommendation on the stock.
Price Performance:
- DLO's share price has given a return of 10.74% in the past three months. On the other hand, in the long term, the stock has corrected by 7.35% over the past six months.
- The stock is leaning towards the higher band of its 52-week range of USD 13.62 and 52-week low price of USD 6.28, with the current price near an important support area of USD 9.50-USD 10.00, therefore an expectation of upward movement if the levels sustain.
- The price is currently above both its short-term (50-day) SMA and long-term (200-day) SMA, with the current RSI of 51.64, upward trending with decent momentum, with expectations of upward movement.

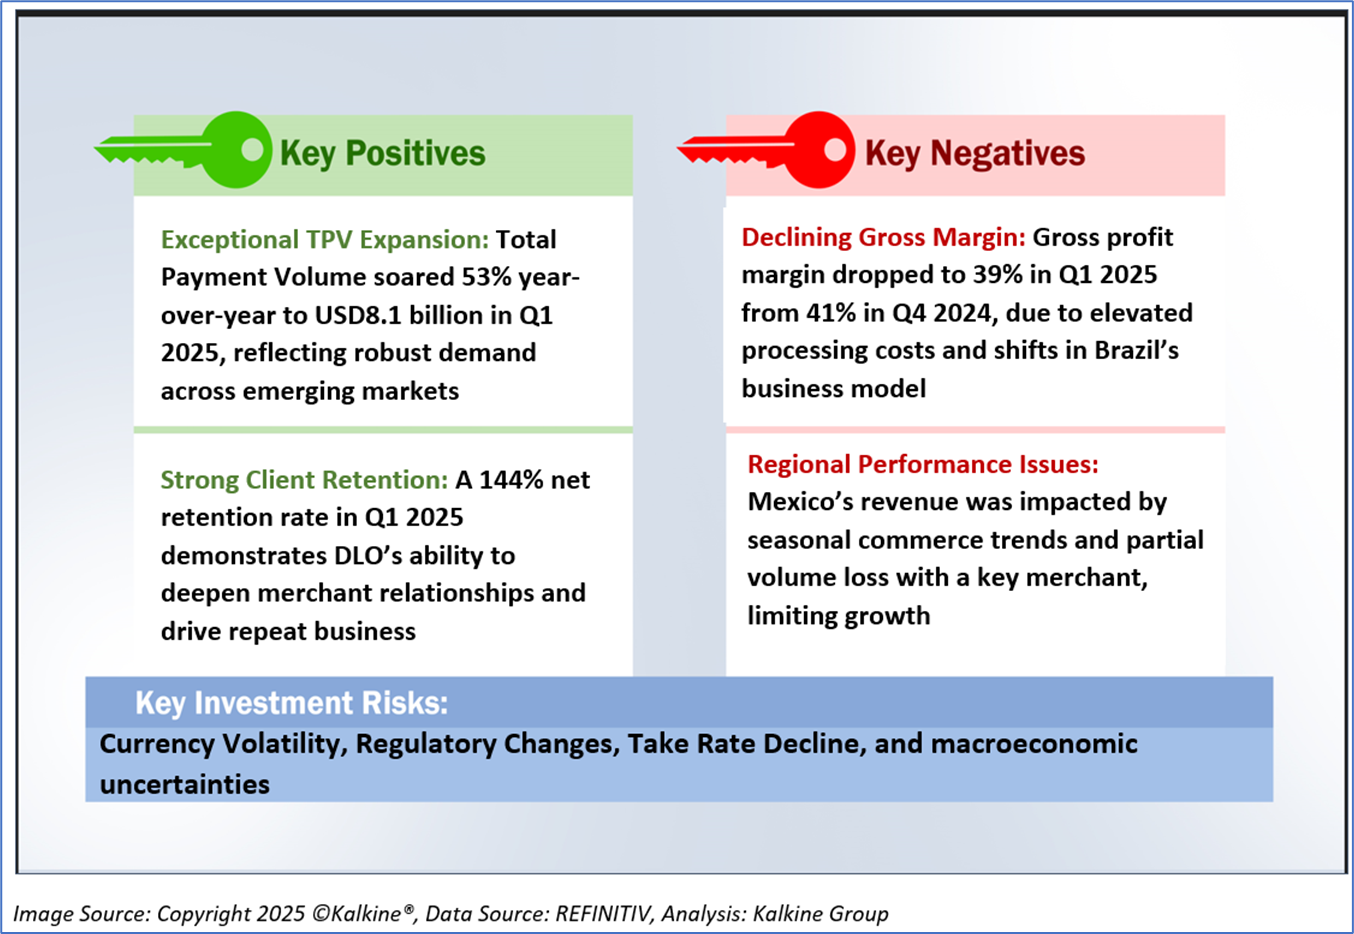
1.2 The Key Positives, Negatives, and Investment summary

1.3 Top 10 shareholders:
The top 10 shareholders together form ~66.77% of the total shareholding, signifying concentrated shareholding. General Atlantic LLC, and Unsal Holdings Ltd are the biggest shareholders, holding the maximum stake in the company at ~42.20% and ~10.80%, respectively.

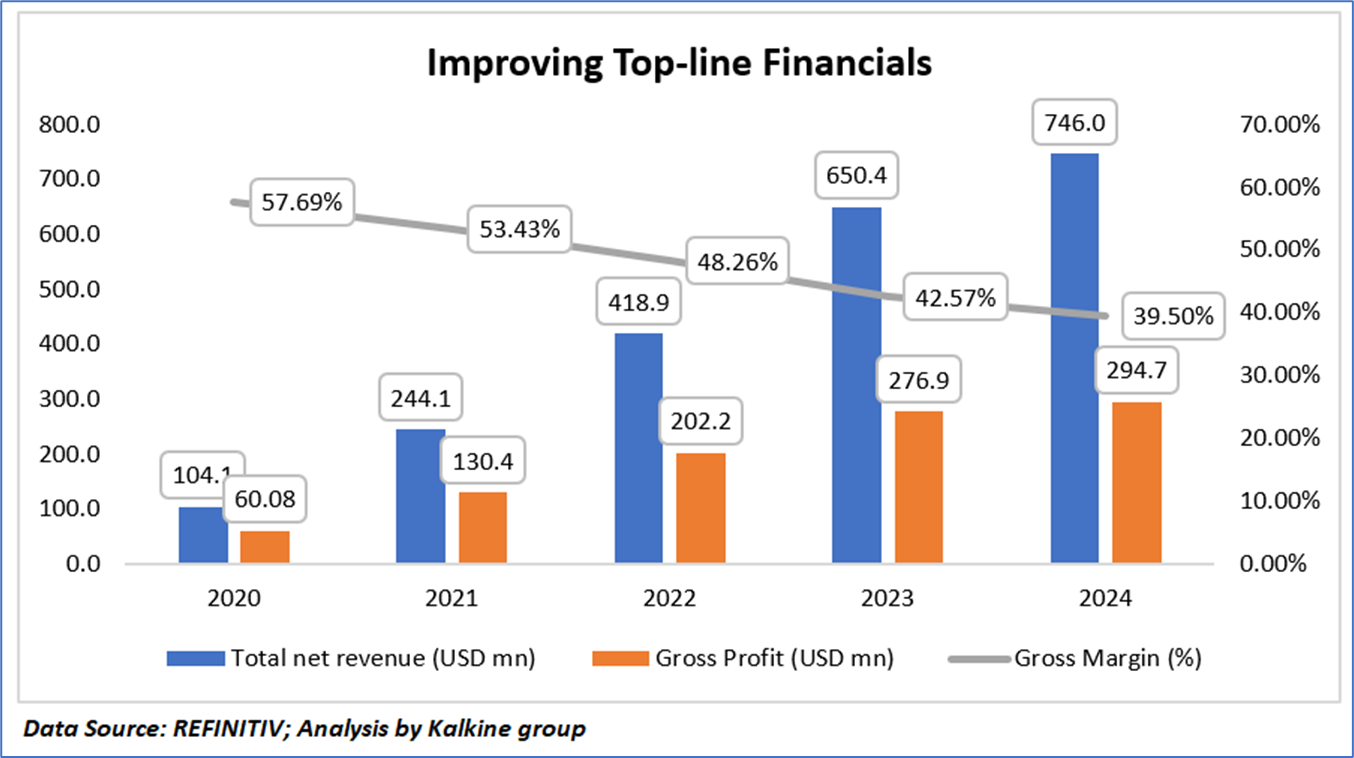
1.4 Key Metrics:
dLocal Limited (NASDAQ: DLO) has demonstrated robust revenue growth from 2020 to 2024, with total net revenue increasing from USD104.1 million to USD746.0 million, reflecting a compound annual growth rate (CAGR) of approximately 63%, driven by its expanding presence in emerging markets and strong demand for cross-border payment solutions. Gross profit also rose significantly from USD60.08 million to USD294.7 million over the same period, showcasing the company's ability to scale operations. However, the gross margin has steadily declined from 57.69% in 2020 to 39.50% in 2024, indicating increasing cost pressures, likely from higher processing costs, competitive pricing, and shifts in business models such as the Payment Orchestration approach in key markets like Brazil, which could challenge profitability despite strong top-line growth.
Section 2: Business Updates and Financial Highlights
2.1 Recent Updates:
The below picture gives an overview of the recent updates:

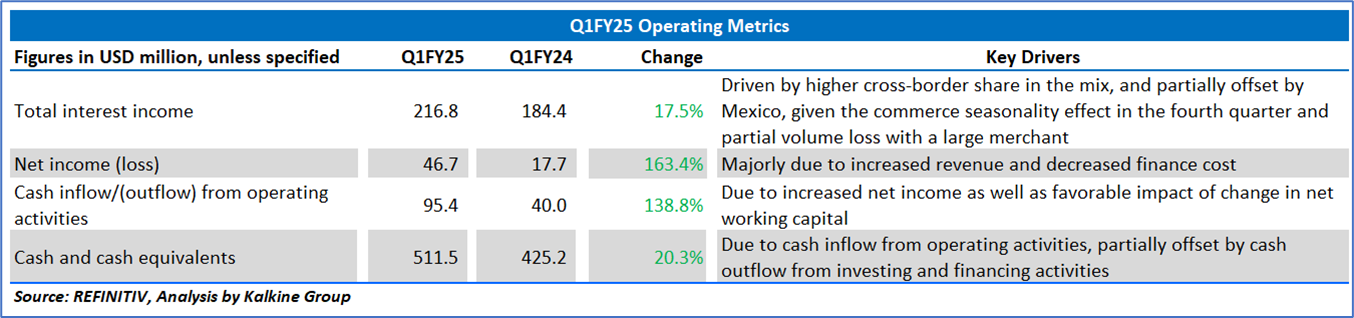
2.2 Insights of Q1FY25:
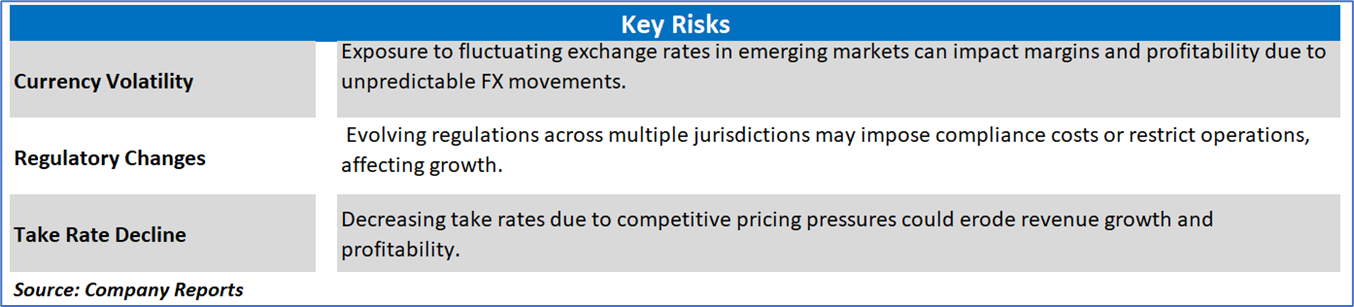
Section 3: Key Risks and Outlook:

Section 4: Stock Recommendation Summary:
4.1 Technical Summary:
Price Performance:
- DLO's share price has given a return of 10.74% in the past three months. On the other hand, in the long term, the stock has corrected by 7.35% over the past six months.
- The stock is leaning towards the higher band of its 52-week range of USD 13.62 and 52-week low price of USD 6.28, with the current price near an important support area of USD 9.50-USD 10.00, therefore an expectation of upward movement if the levels sustain.
- The price is currently above both its short-term (50-day) SMA and long-term (200-day) SMA, with the current RSI of 51.64, upward trending with decent momentum, with expectations of upward movement.


4.2 Fundamental Valuation
Valuation Methodology: Price/Earnings Per Share Multiple Based Relative Valuation
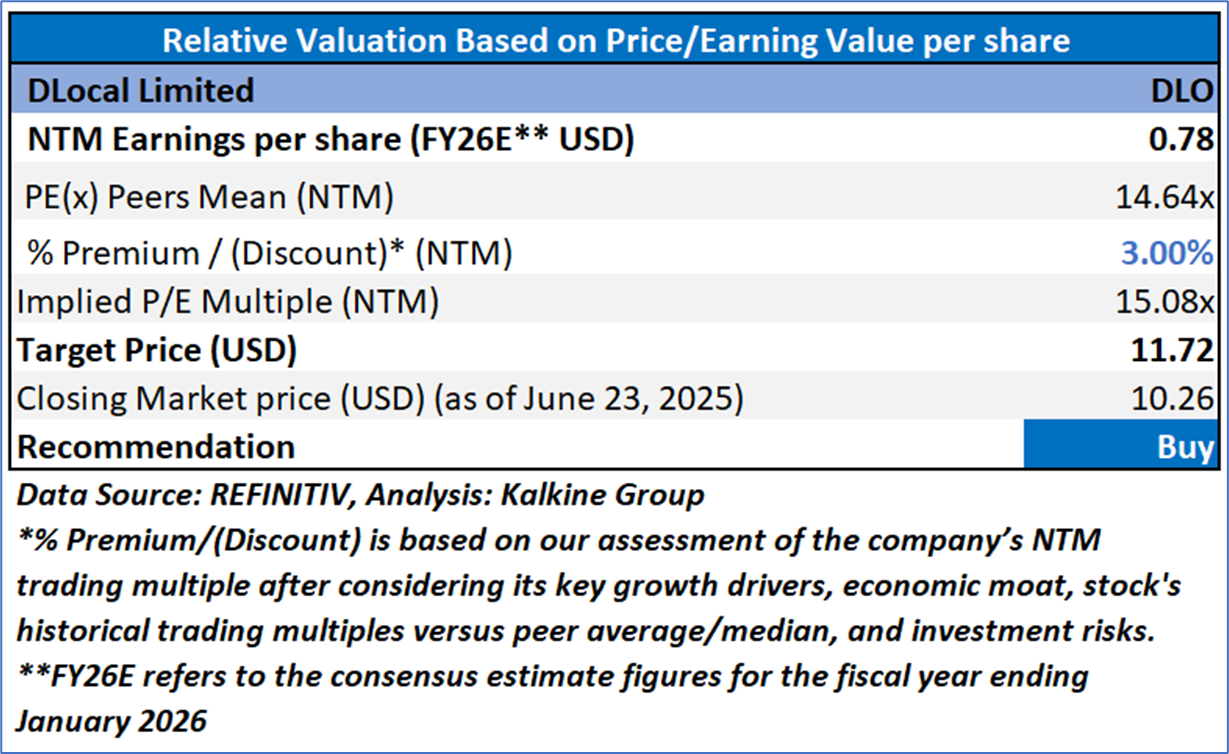

Markets are trading in a highly volatile zone currently due to certain macroeconomic issues and geopolitical tensions prevailing. Therefore, it is prudent to follow a cautious approach while investing.
Note 1: Past performance is not a reliable indicator of future performance.
Note 2: The reference date for all price data, currency, technical indicators, support, and resistance levels is June 23, 2025. The reference data in this report has been partly sourced from REFINITIV.
Note 3: Investment decisions should be made depending on an individual's appetite for upside potential, risks, holding duration, and any previous holdings. An 'Exit' from the stock can be considered if the Target Price mentioned as per the Valuation and or the technical levels provided has been achieved and is subject to the factors discussed above.
Note 4: The report publishing date is as per the Pacific Time Zone.
Technical Indicators Defined: -
Support: A level at which the stock prices tend to find support if they are falling, and a downtrend may take a pause backed by demand or buying interest. Support 1 refers to the nearby support level for the stock and if the price breaches the level, then Support 2 may act as the crucial support level for the stock.
Resistance: A level at which the stock prices tend to find resistance when they are rising, and an uptrend may take a pause due to profit booking or selling interest. Resistance 1 refers to the nearby resistance level for the stock and if the price surpasses the level, then Resistance 2 may act as the crucial resistance level for the stock.
Stop-loss: It is a level to protect against further losses in case of unfavorable movement in the stock prices.
Past performance is not a reliable indicator of future performance.

 Please wait processing your request...