Section 1: Company Overview and Fundamentals
1.1 Company Overview:
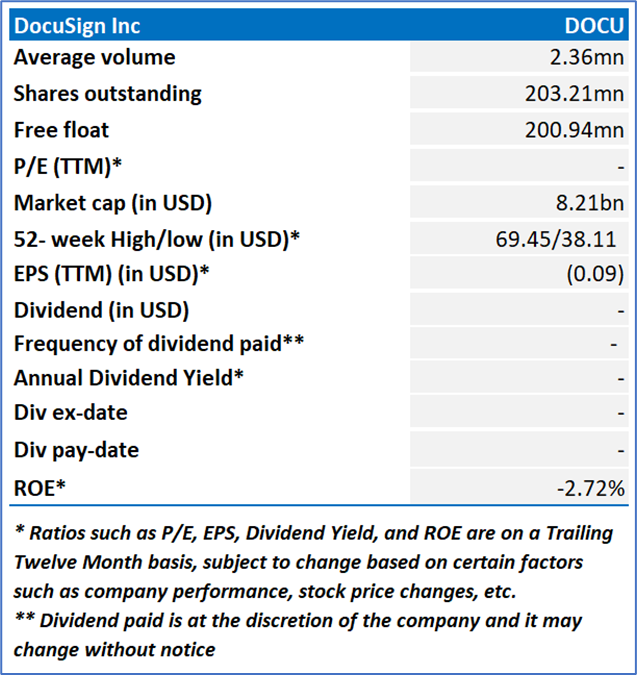
DocuSign, Inc. (NASDAA: DOCU) offers electronic signature products, enabling an agreement to be signed electronically on a variety of devices, from virtually anywhere in the world. The Company offers DocuSign Agreement Cloud, which is a cloud software platform that automates and connects the entire agreement process. It includes DocuSign eSignature, an electronic signature solution.
Kalkine’s American Tech Report covers the Company Overview, Key positives & negatives, Investment summary, Key investment metrics, Top 10 shareholding, Business updates and insights into company recent financial results, Key Risks & Outlook, Price performance and technical summary, Target Price, and Recommendation on the stock.
Stock Performance:
- DOCU has corrected by 21.55% in the past three months, and with an 18.03% of correction in the past six months.
- The stock is leaning towards its lower band of its 52-week range of USD 69.45 and 52-week low price of USD 38.11. Post the announcement of Q2FY24 results the stock has corrected by around 22.25%, with currently price near a support zone of USD 38-USD 40.
- The price is currently trading below its long-term (200-day) SMA and its short-term (50-day) SMA, with the current RSI of around 46.39.
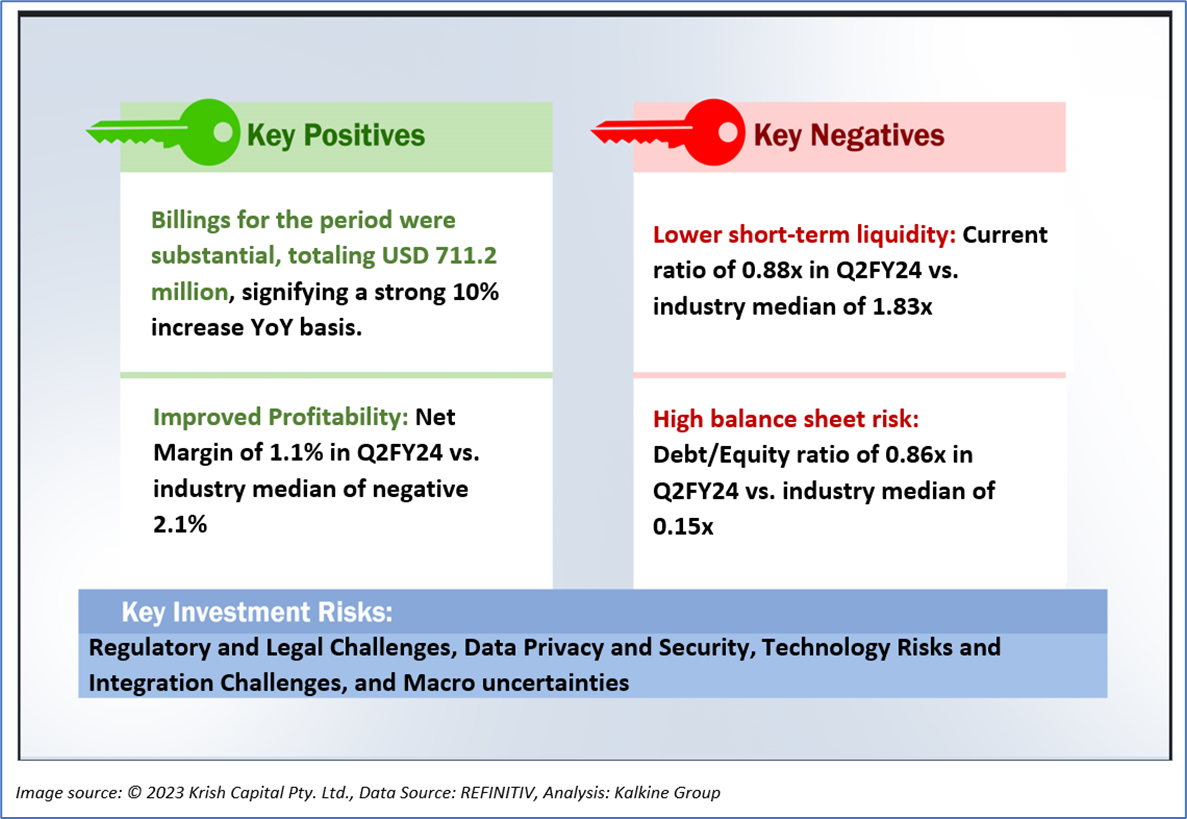
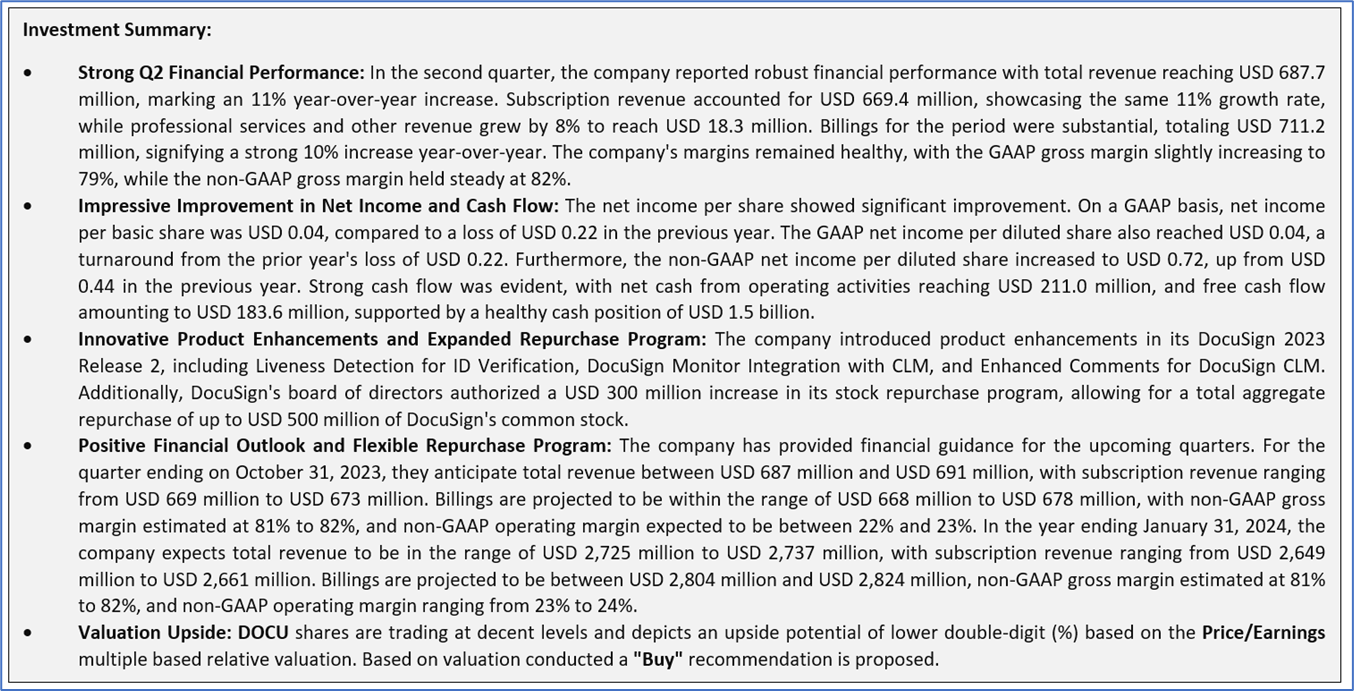
1.2 The Key Positives, Negatives, and Investment summary
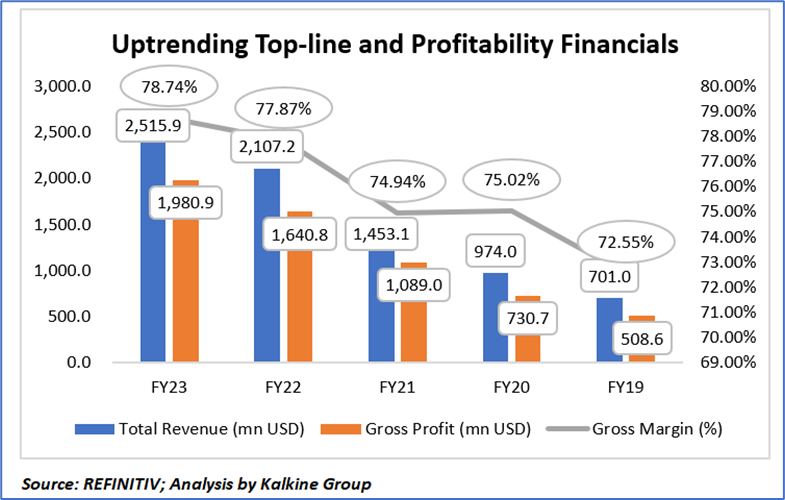
1.3 Key Metrics:
The chart provided illustrates remarkable advancements in both revenue and profitability for the company over the last five years. Notably, the company's revenue surged from USD 701 million in FY19 to USD 2515.9 million in FY23, accompanied by an increase in gross profit from USD 508.6 million to 1980.9 million in FY23. Additionally, the consistently rising gross margin throughout this five-year span indicates the company's improved adeptness in handling its direct costs. This suggests enhanced operational efficiency and a potentially well-structured cost management strategy implemented by the company during this period. The significant growth in both revenue and profitability metrics demonstrates the company's successful endeavors in expanding its market presence and optimizing its financial performance.
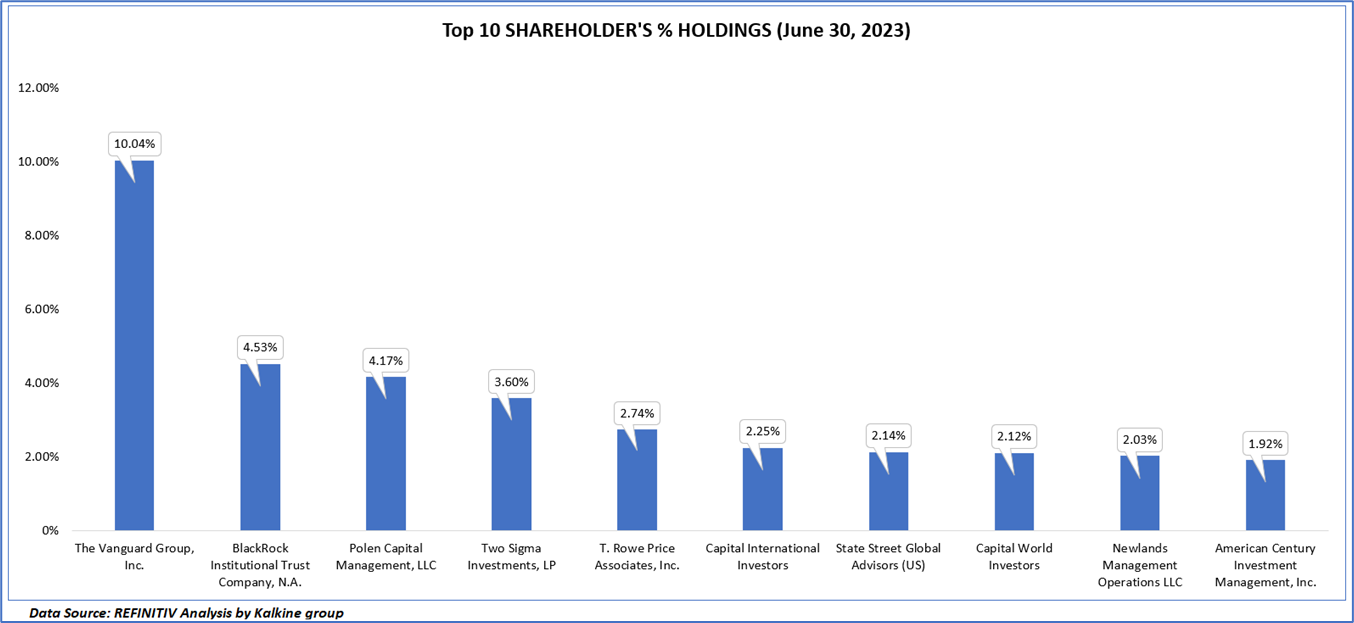
1.4 Top 10 shareholders:
The top 10 shareholders together form ~35.54% of the total shareholding, signifying diverse shareholding. The Vanguard Group, Inc., and BlackRock Institutional Trust Company, N.A. are the biggest shareholders, holding the maximum stake in the company at ~10.04% and ~4.53%, respectively.
Section 2: Business Updates and Corporate Business Highlights
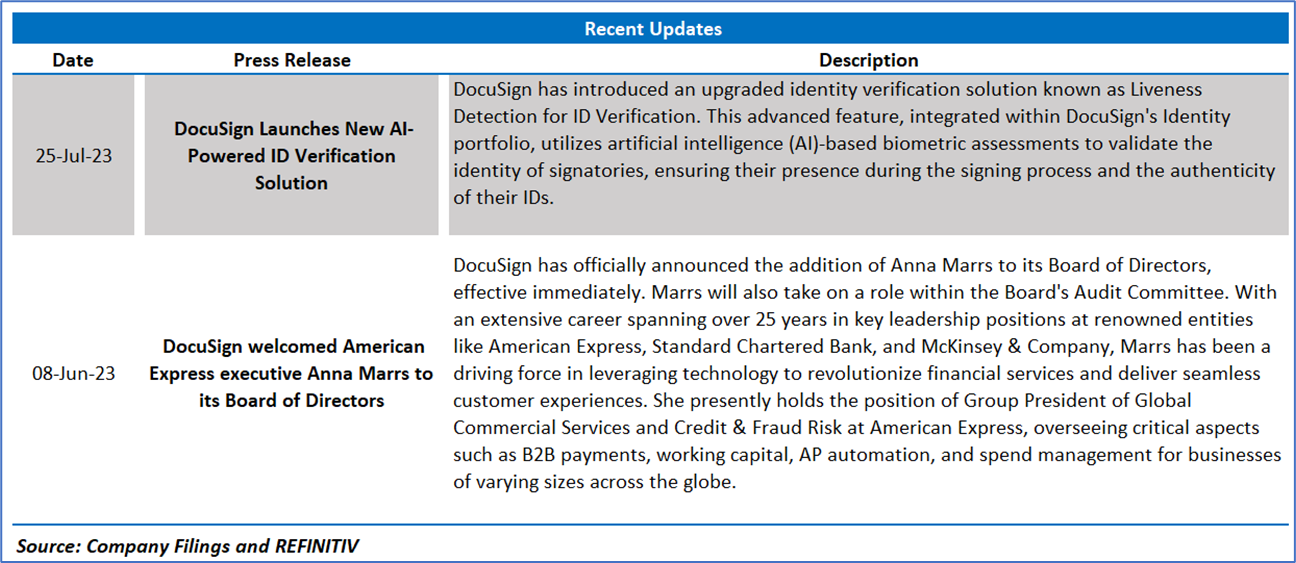
2.1 Recent Updates:
The below picture gives an overview of the recent updates:
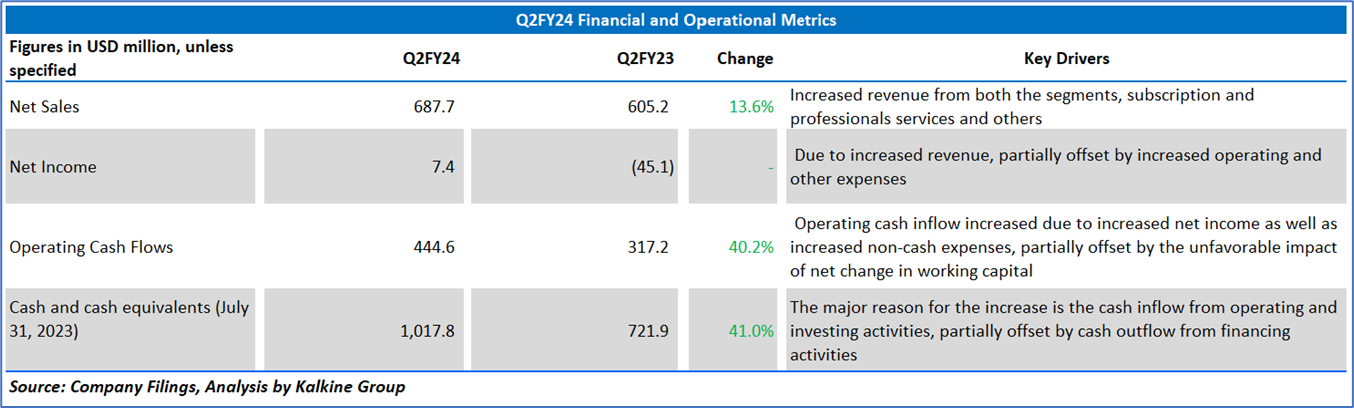
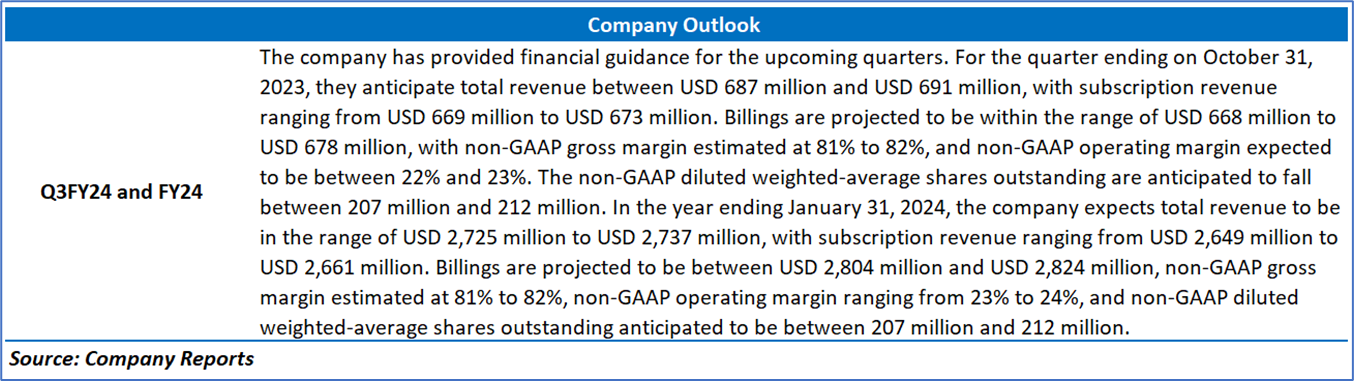
2.2 Insights of Q2FY24:
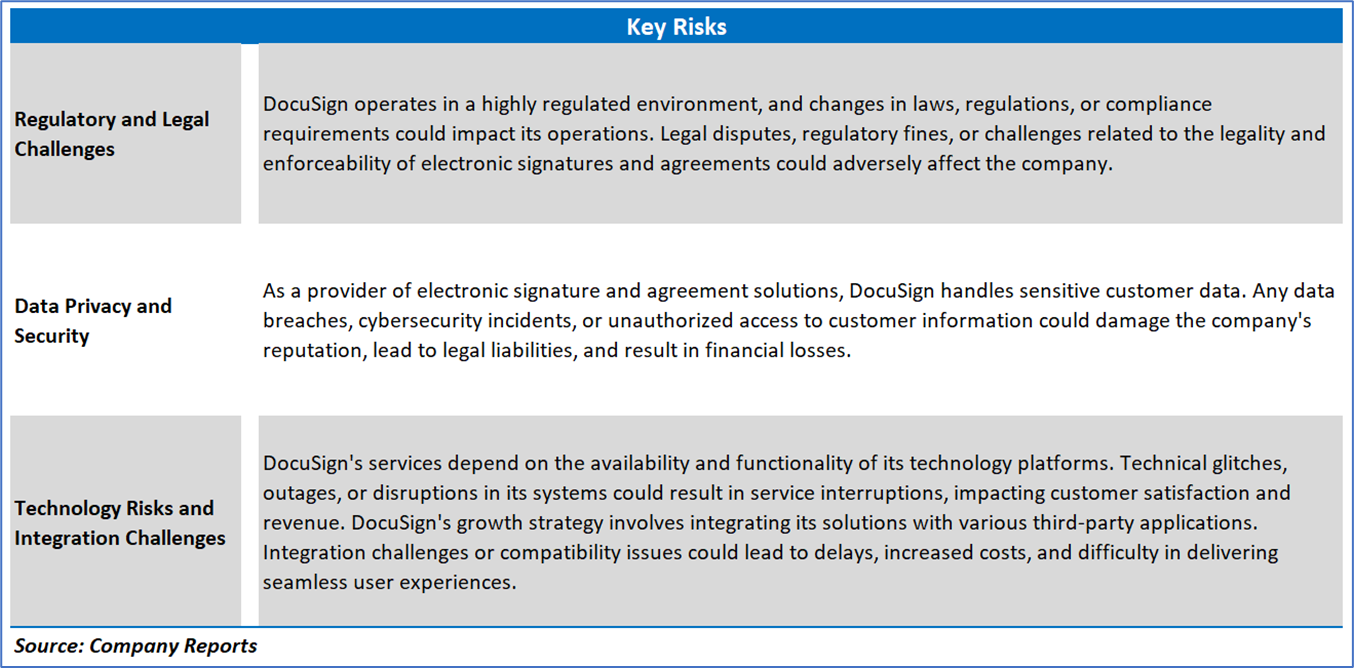
Section 3: Key Risks and Outlook
Section 4: Stock Recommendation Summary:
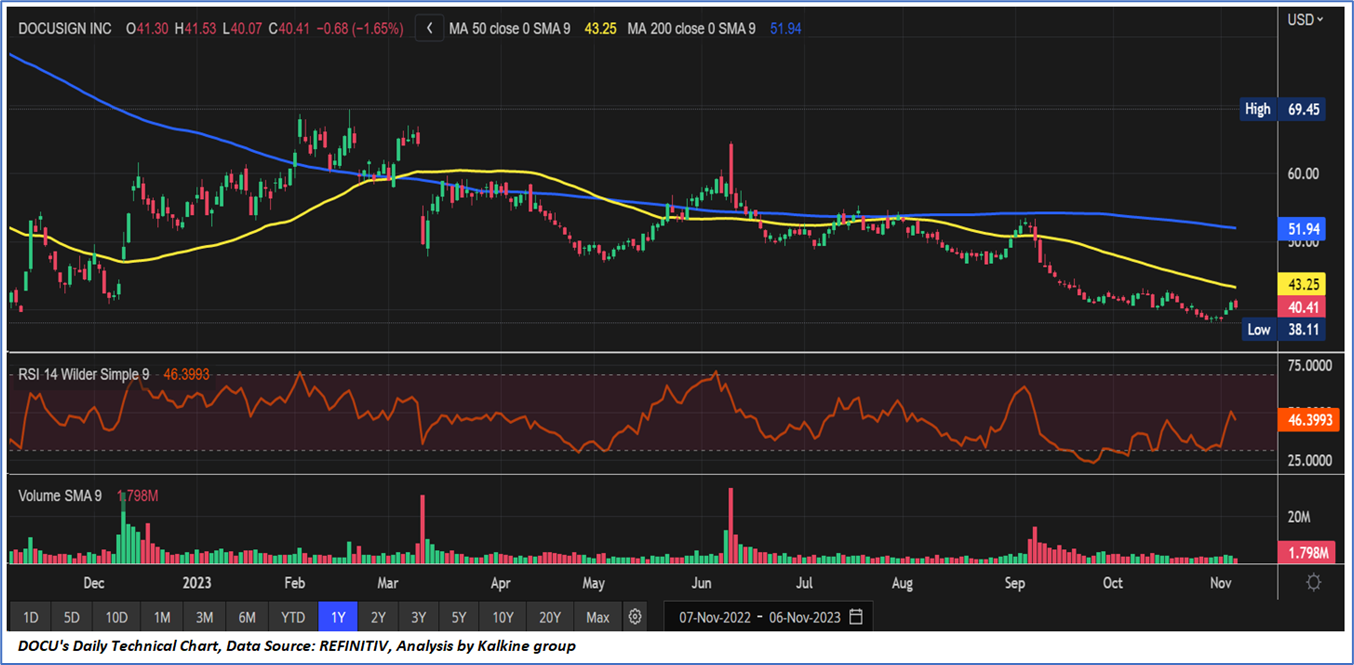
4.1 Price Performance and Technical Summary:
Stock Performance:
- DOCU has corrected by 21.55% in the past three months, and with an 18.03% of correction in the past six months.
- The stock is leaning towards its lower band of its 52-week range of USD 69.45 and 52-week low price of USD 38.11. Post the announcement of Q2FY24 results the stock has corrected by around 22.25%, with currently price near a support zone of USD 38-USD 40.
- The price is currently trading below its long-term (200-day) SMA and its short-term (50-day) SMA, with the current RSI of around 46.39.
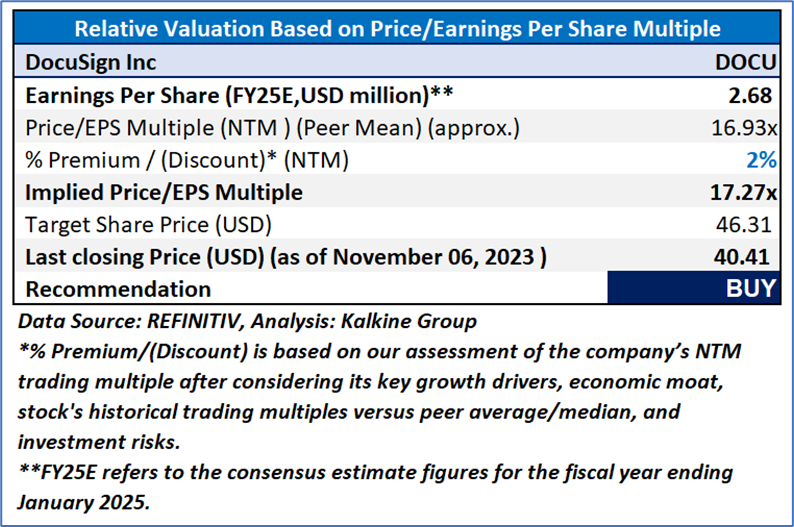
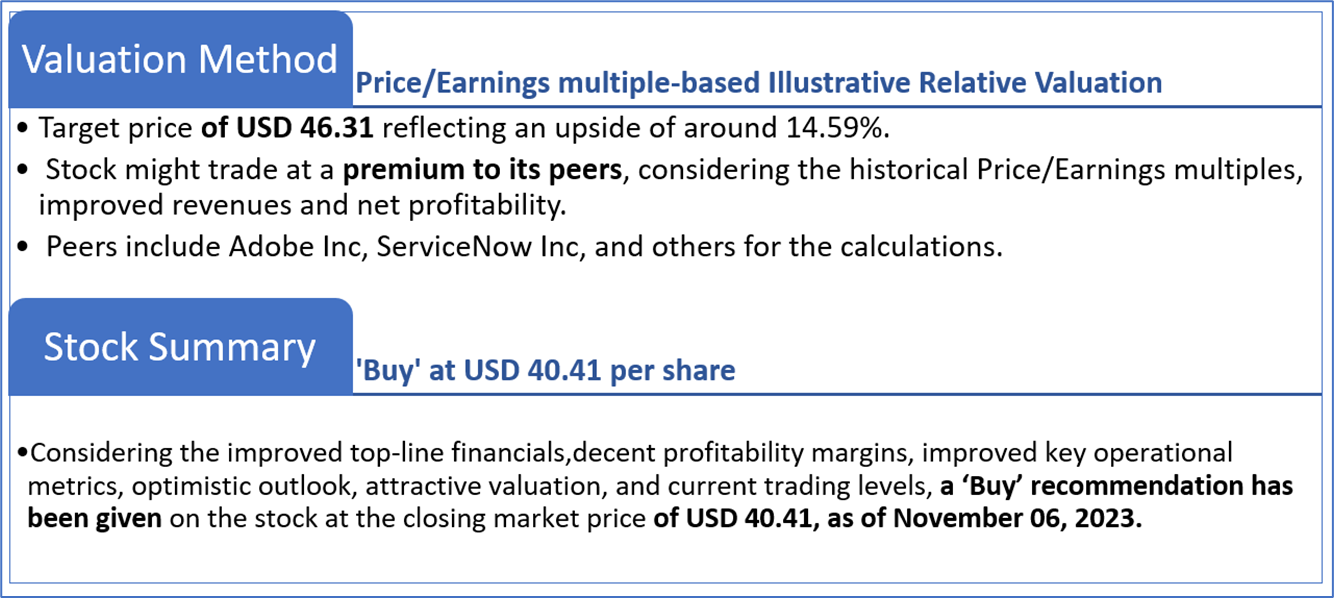
4.2 Fundamental Valuation
Valuation Methodology: Price/Earnings per share Multiple Based Relative Valuation
Markets are trading in a highly volatile zone currently due to certain macroeconomic issues and geopolitical tensions prevailing. Therefore, it is prudent to follow a cautious approach while investing.
Note 1: Past performance is not a reliable indicator of future performance.
Note 2: The reference date for all price data, currency, technical indicators, support, and resistance levels is November 06, 2023. The reference data in this report has been partly sourced from REFINITIV.
Note 3: Investment decisions should be made depending on an individual's appetite for upside potential, risks, holding duration, and any previous holdings. An 'Exit' from the stock can be considered if the Target Price mentioned as per the Valuation and or the technical levels provided has been achieved and is subject to the factors discussed above.
Note 4: The report publishing date is as per the Pacific Time Zone.
Technical Indicators Defined: -
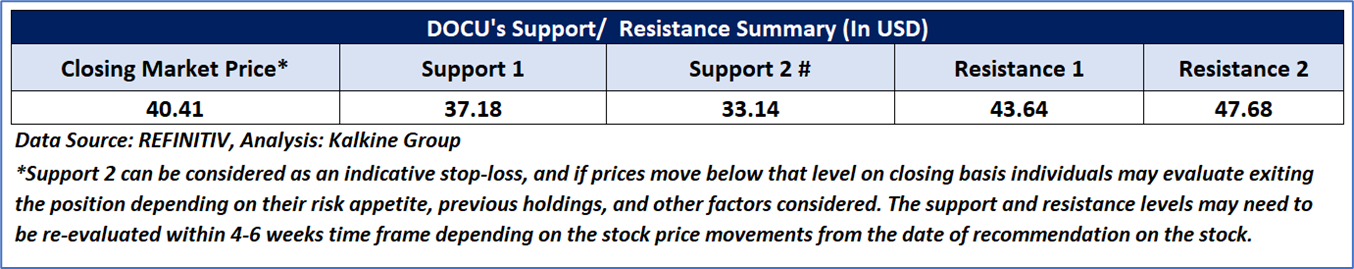
Support: A level at which the stock prices tend to find support if they are falling, and a downtrend may take a pause backed by demand or buying interest. Support 1 refers to the nearby support level for the stock and if the price breaches the level, then Support 2 may act as the crucial support level for the stock.
Resistance: A level at which the stock prices tend to find resistance when they are rising, and an uptrend may take a pause due to profit booking or selling interest. Resistance 1 refers to the nearby resistance level for the stock and if the price surpasses the level, then Resistance 2 may act as the crucial resistance level for the stock.
Stop-loss: It is a level to protect against further losses in case of unfavorable movement in the stock prices.
Past performance is not a reliable indicator of future performance.

 Please wait processing your request...