Section 1: Company Overview, Shariah Compliance Standards and Fundamentals
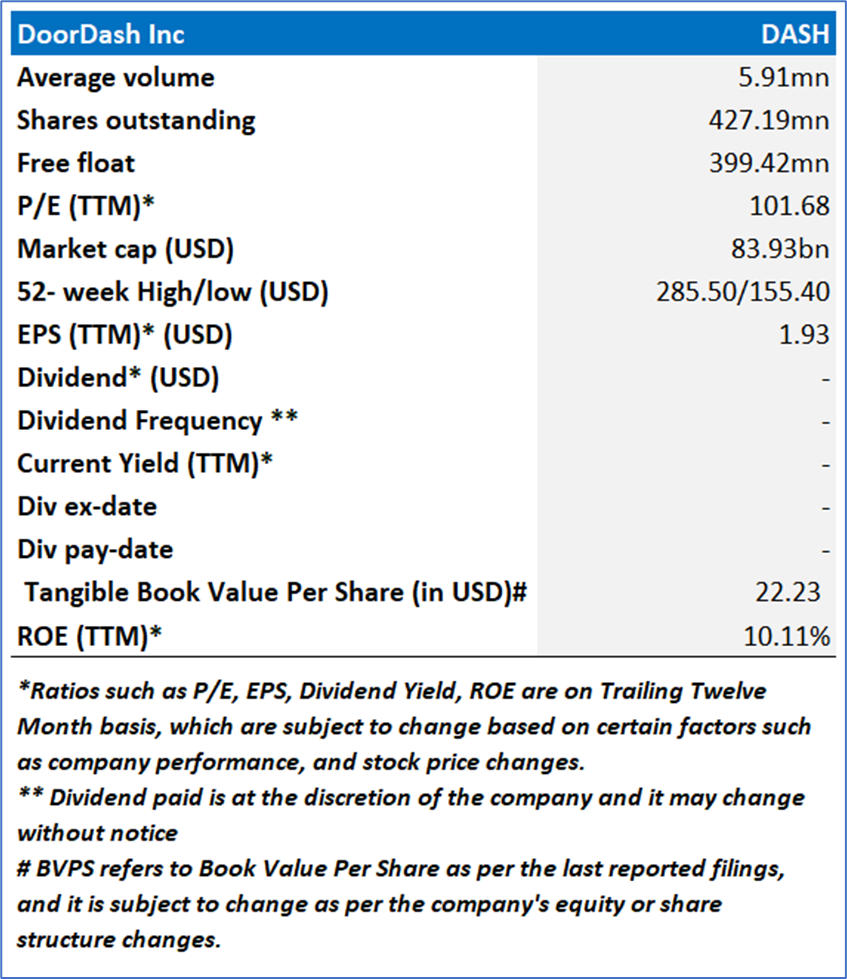
Section 1.1: DoorDash, Inc. (NASDAQ: DASH) is engaged in providing services that reduce friction in local commerce and help merchants connect with consumers in their communities. The Company's primary offerings include the DoorDash Marketplace and the Wolt Marketplace (together, the Marketplaces), and its Commerce Platform.
Kalkine’s ‘The Shariah Compliance Report’ covers the Investment Highlights, Shariah-compliance standards, Key Financial Metrics, Risks, and Technical Analysis along with the Valuation, Target Price, and Recommendation on the stock.
Section 1.2: What are the Key Metrics for Shariah Compliance to be Considered?
The Shariah Compliance Report aims to identify equities that align with Shariah and ethical principles, providing valuable insights on financial metrics, business activities and compliance with Islamic finance norms.
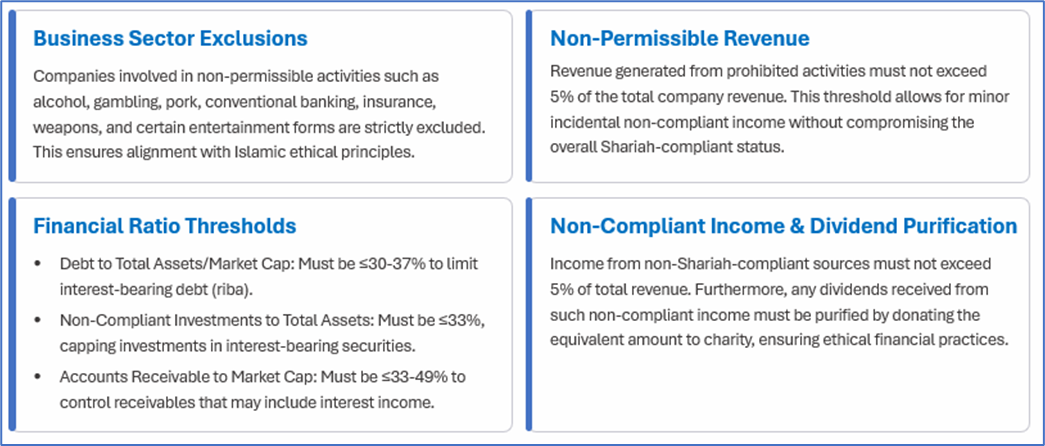
Key Shariah Screening Criteria and Thresholds
Shariah Metrics for DoorDash Inc (NASDAQ: DASH):
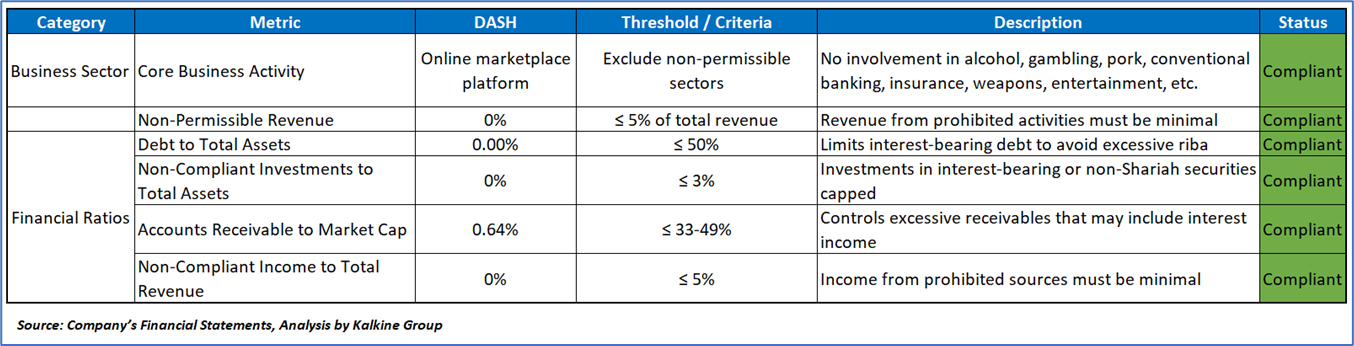
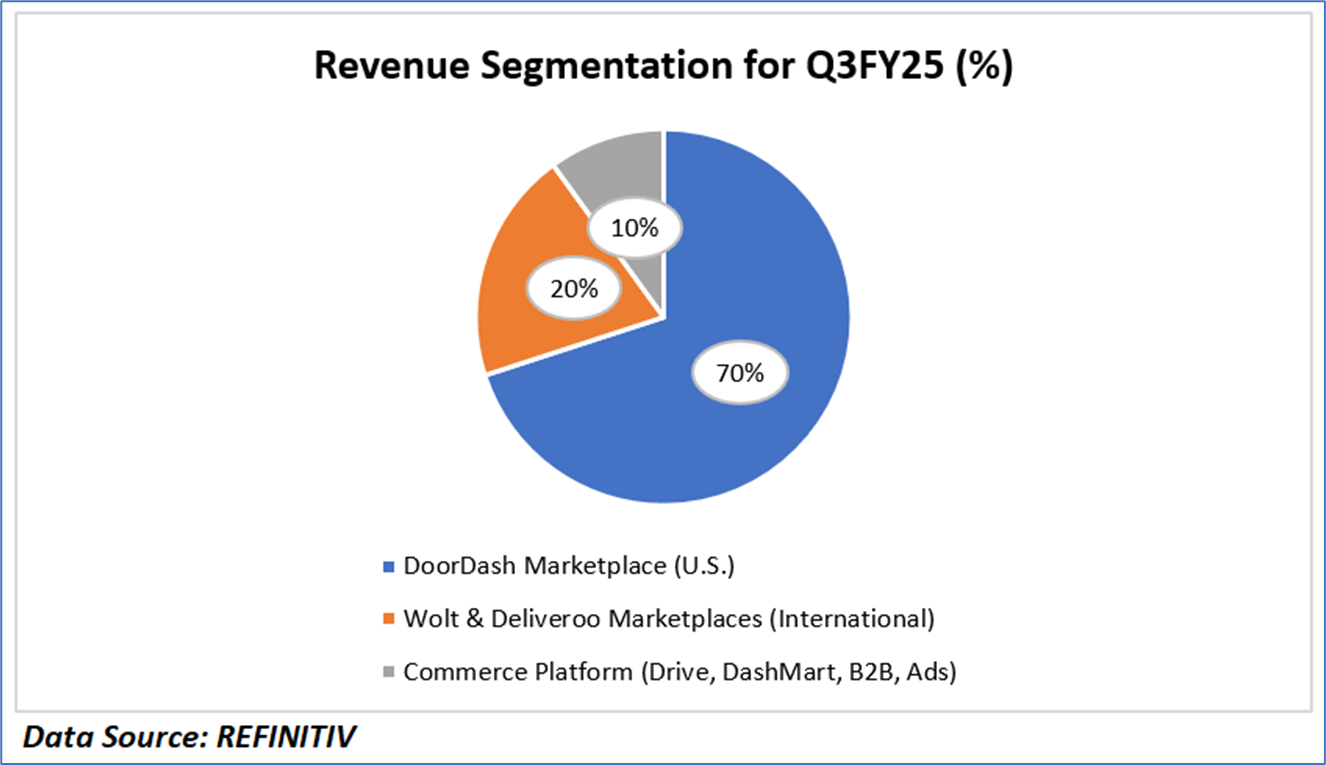
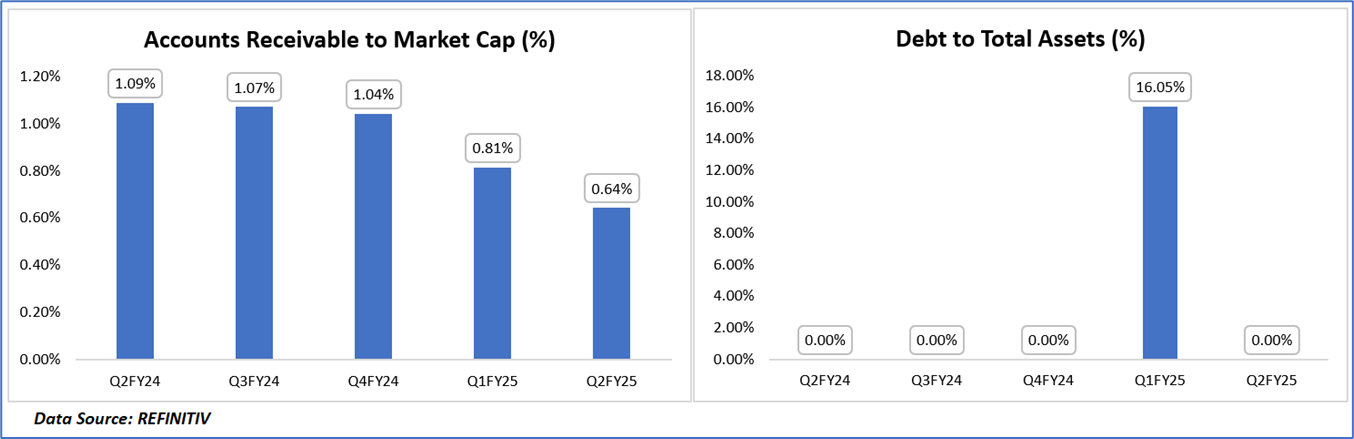
Revenue Segmentation of DASH in Q3FY25 & Historical Compliance of Financial Ratios:
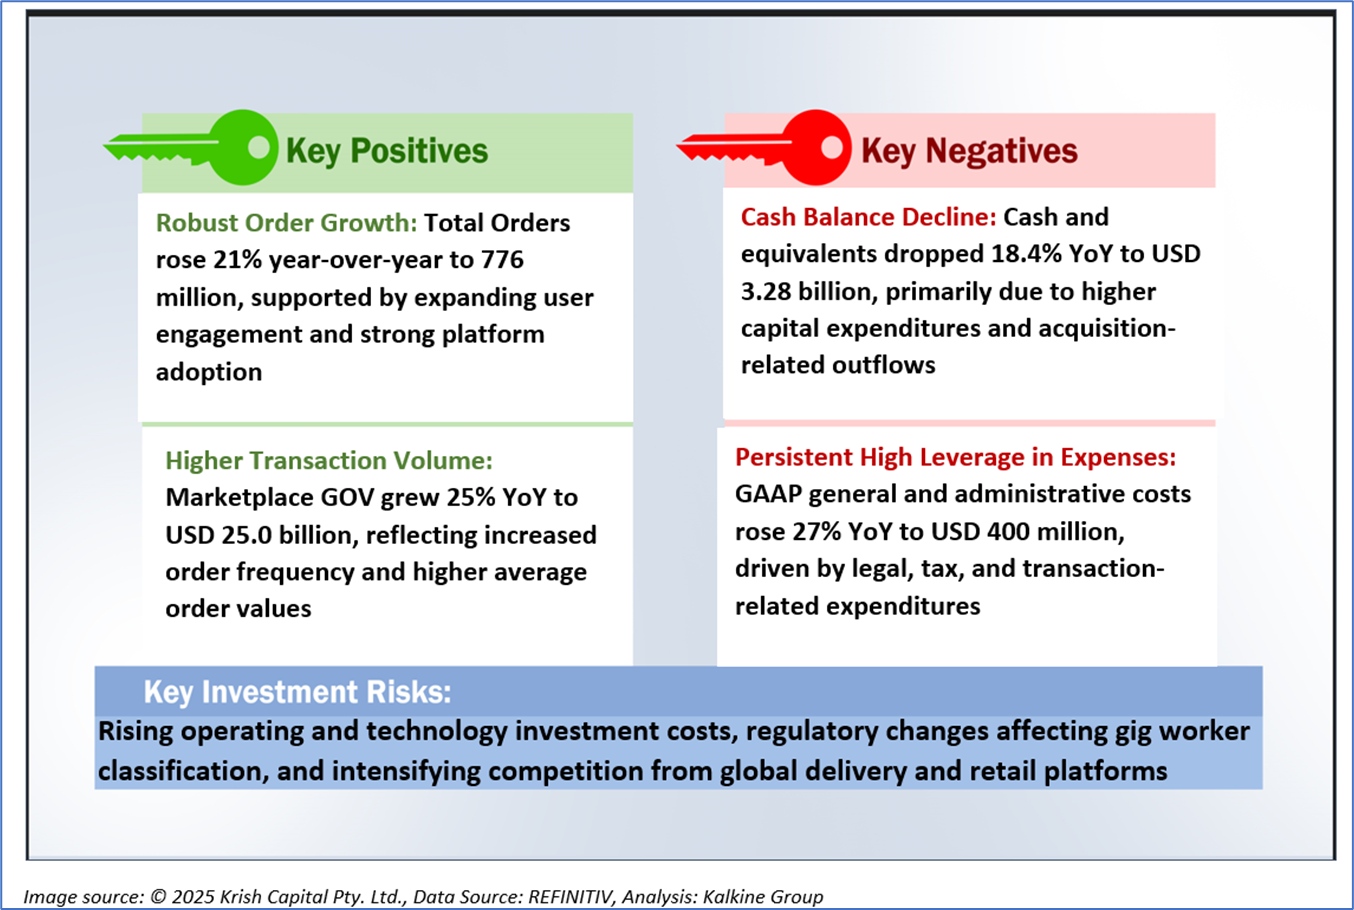
1.3 The Key Positives, Negatives, and Investment summary
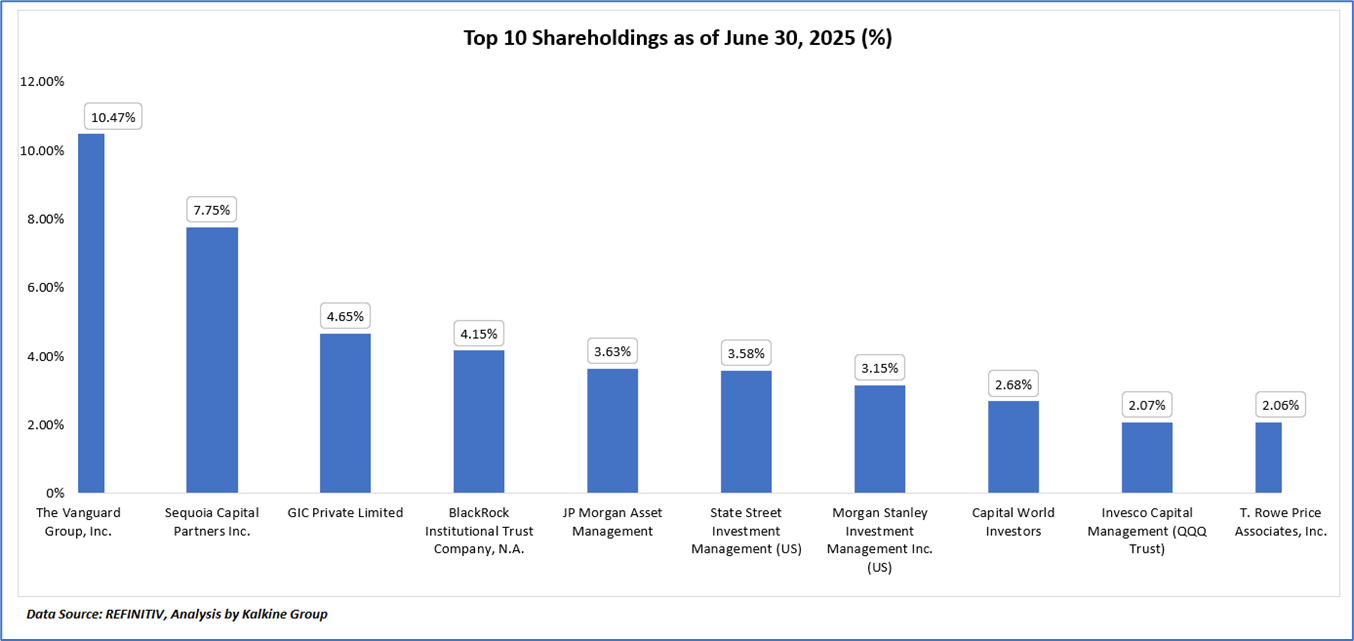
1.4 Top 10 shareholders:
The top 10 shareholders together form ~44.18% of the total shareholding, signifying concentrated shareholding. The Vanguard Group, Inc., and Sequoia Capital Partners Inc. are the biggest shareholders, holding the maximum stake in the company at ~10.47% and ~7.75%, respectively.
1.5 Key Metrics:
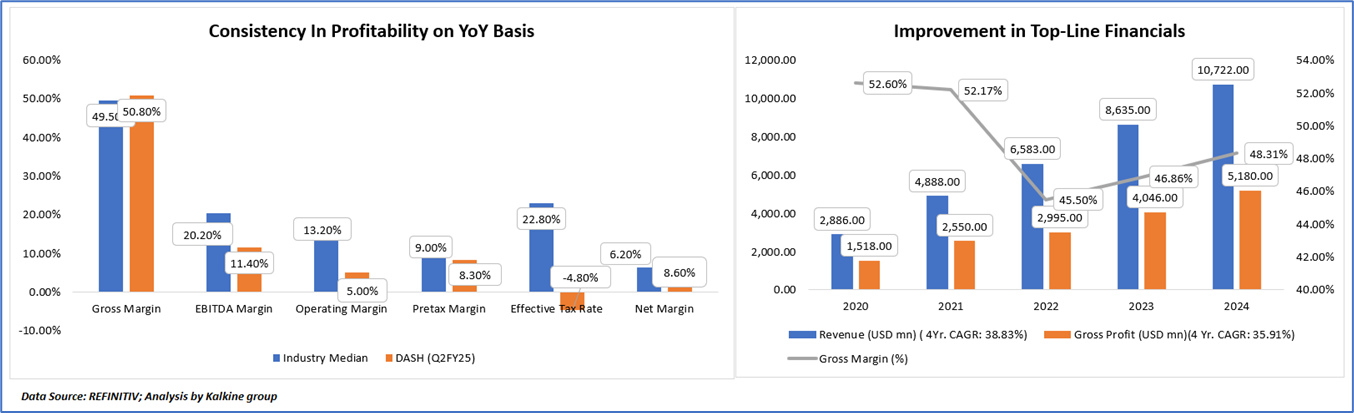
DoorDash, Inc. (NYSE: DASH) has exhibited strong topline expansion over the past four years, with revenue rising from USD 2.9 billion in 2020 to USD 10.7 billion in 2024, translating to a four-year CAGR of 38.83%. This robust trajectory reflects the company’s rapid scale-up across restaurant delivery, grocery, and new verticals, alongside international growth through Wolt and the recently acquired Deliveroo. Gross profit increased at a 35.91% CAGR, reaching USD 5.18 billion in 2024, driven by efficiency improvements, higher order density, and expanding contribution margins. Although gross margin moderated from 52.6% in 2020 to 48.3% in 2024 due to rising logistics costs and reinvestment in fulfillment infrastructure, the recent stabilization reflects DoorDash’s operational maturity and technological leverage.
In terms of profitability metrics, DoorDash continues to close the gap with industry peers. As of Q2 FY2025, its gross margin of 50.8% exceeded the industry median of 49.5%, indicating strong cost control and improving unit economics. However, the company’s EBITDA margin (11.4%) and operating margin (5.0%) remain below industry levels, reflecting continued reinvestment in platform development, automation, and global integration. Despite a temporarily negative effective tax rate due to deferred tax adjustments, DoorDash’s net margin of 8.6% surpasses the sector median, signaling an improving profit structure. Overall, DoorDash’s consistent revenue growth, rising gross efficiency, and emerging profitability position it favorably for long-term margin expansion as reinvestments begin to yield operational leverage.
Section 2: Business Updates and Financial Highlights
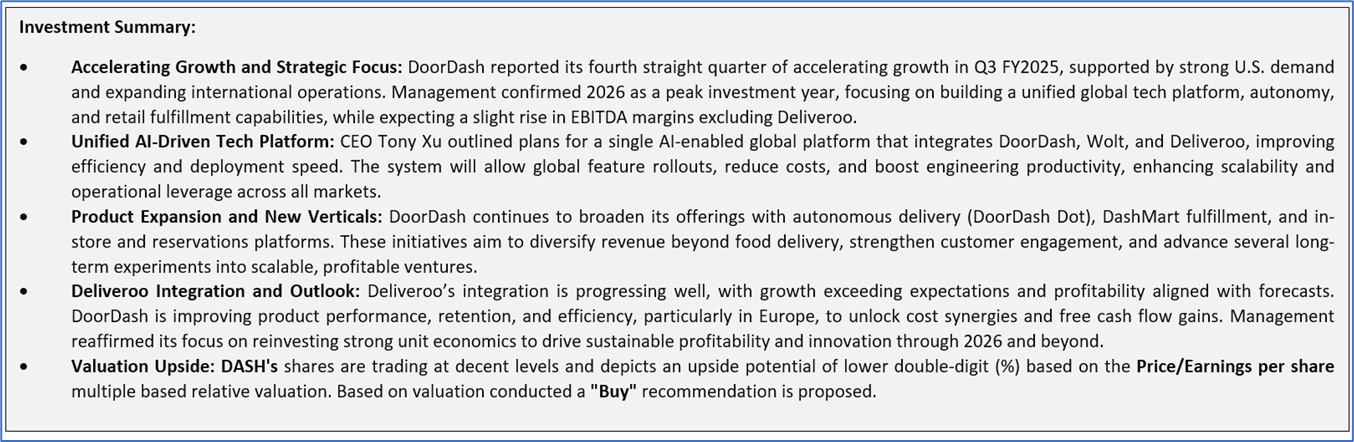
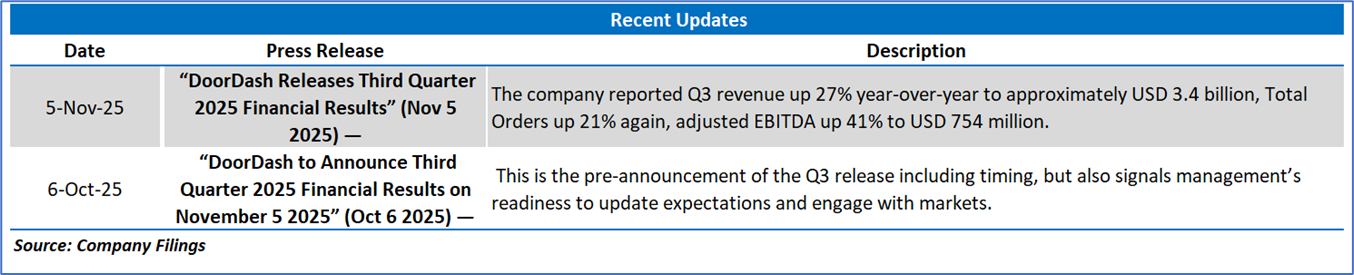
2.1 Recent Updates:
The below picture gives an overview of the recent updates:
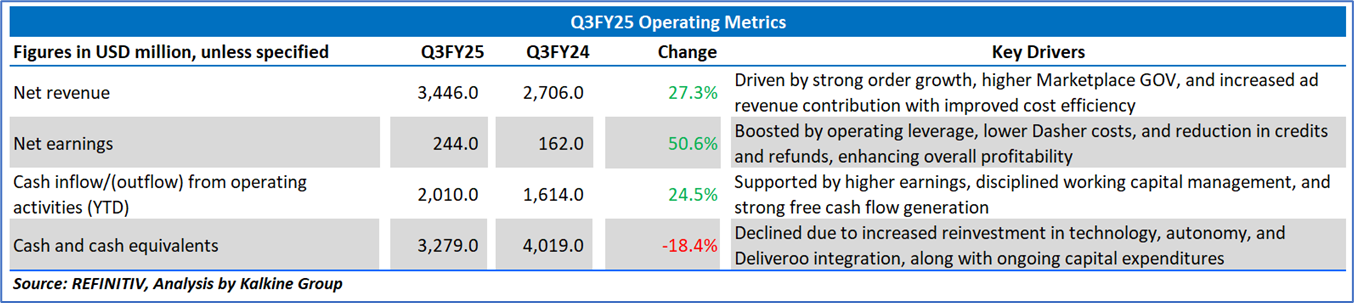
2.2 Insights of Q3FY25:
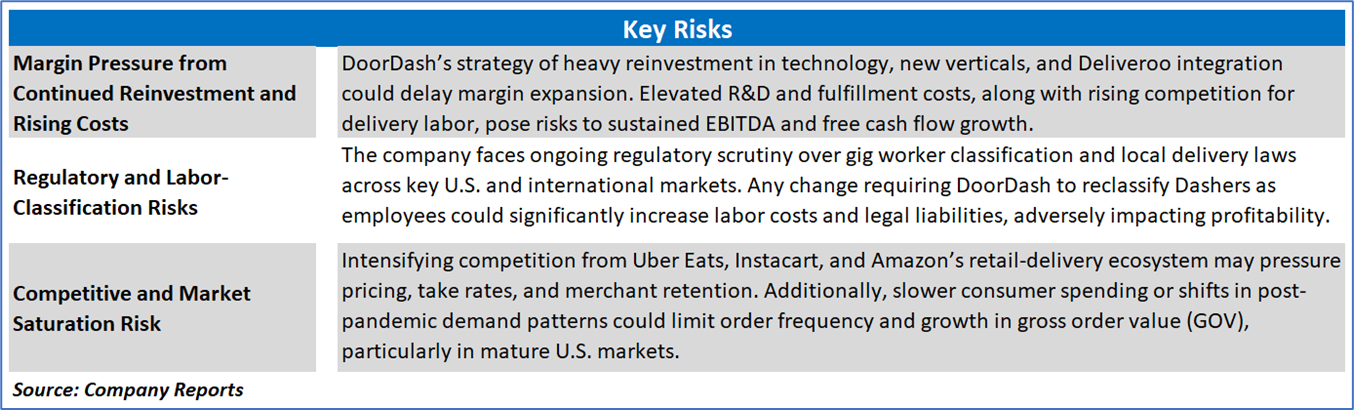
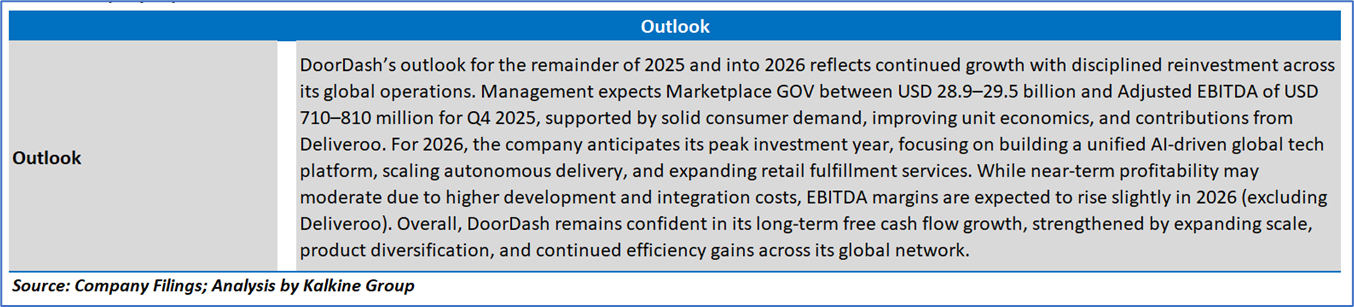
Section 3: Key Risks and Outlook:
Section 4: Stock Recommendation Summary:
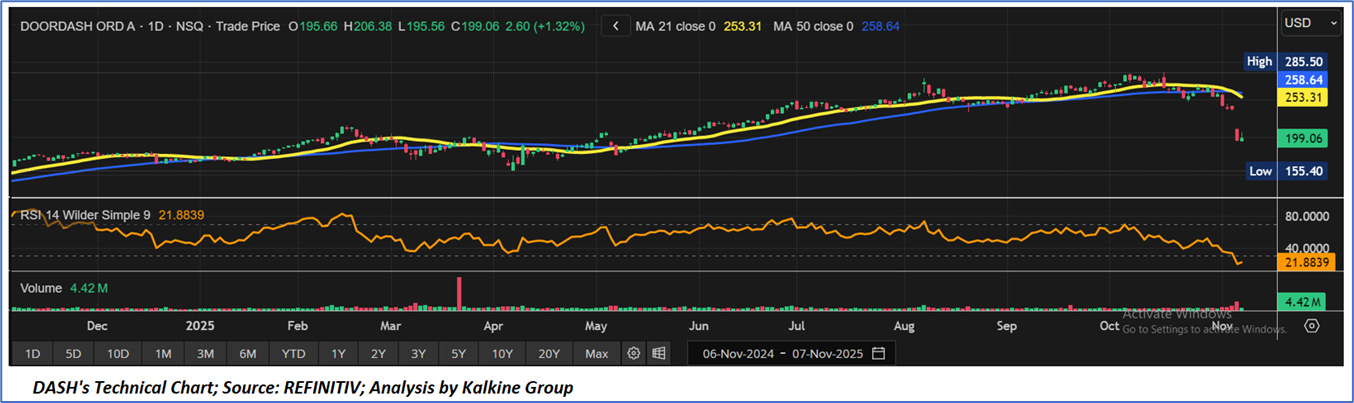
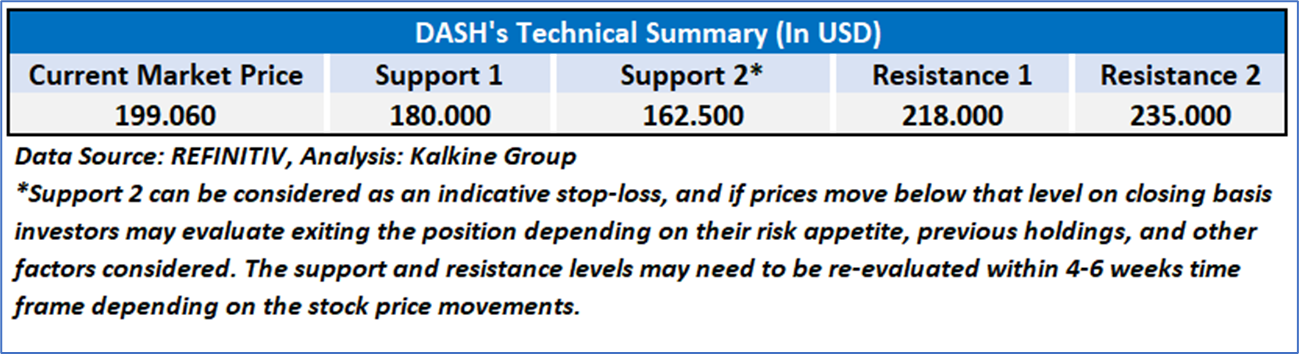
4.1 Technical Summary:
- Price Trend and Moving Averages: DoorDash, Inc. (NASDAQ: DASH) shows a bearish short-term trend, trading at USD 199.06, well below its 21-day (USD 253.31) and 50-day (USD 258.64) moving averages. The breakdown from the USD 250–260 zone confirms weakening momentum, with near-term support seen around USD 180–155, indicating potential for further consolidation before a rebound.
- Momentum Indicators: The RSI at 21.88 signals the stock is deeply oversold, reflecting intense selling pressure but also the potential for a short-term technical bounce. However, the lack of bullish divergence suggests that any recovery may be limited unless buying volume strengthens materially.
- Market Sentiment and Outlook: Trading volume at 4.42 million indicates subdued buyer conviction despite easing sell pressure. A sustained reversal would require the stock to reclaim the USD 220–230 range to confirm stabilization, while long-term investors could consider accumulating near key supports given the company’s solid fundamentals and growth potential.
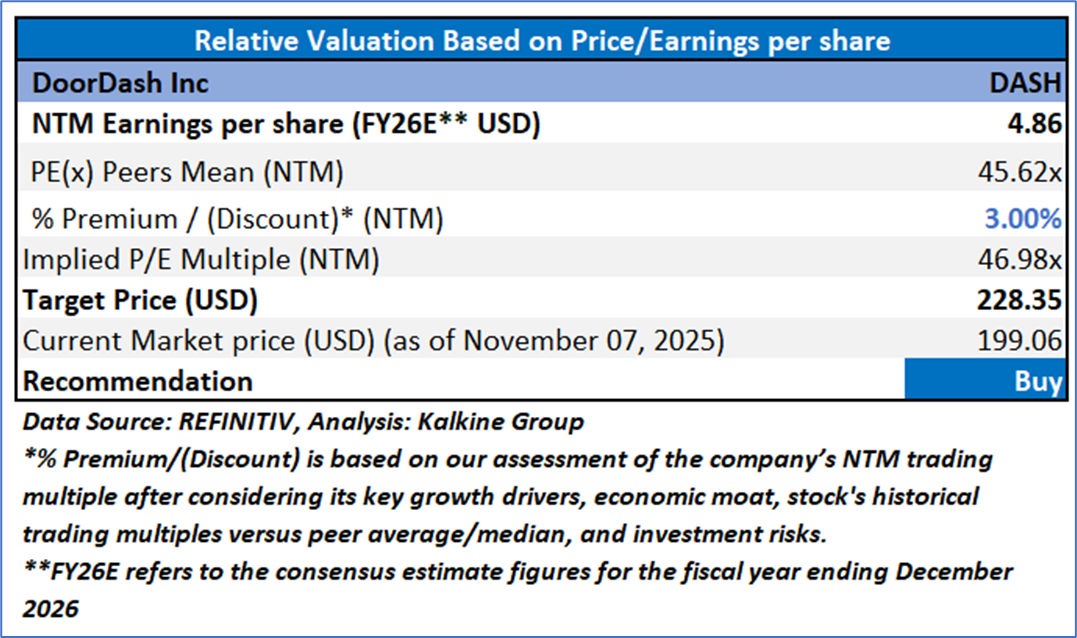
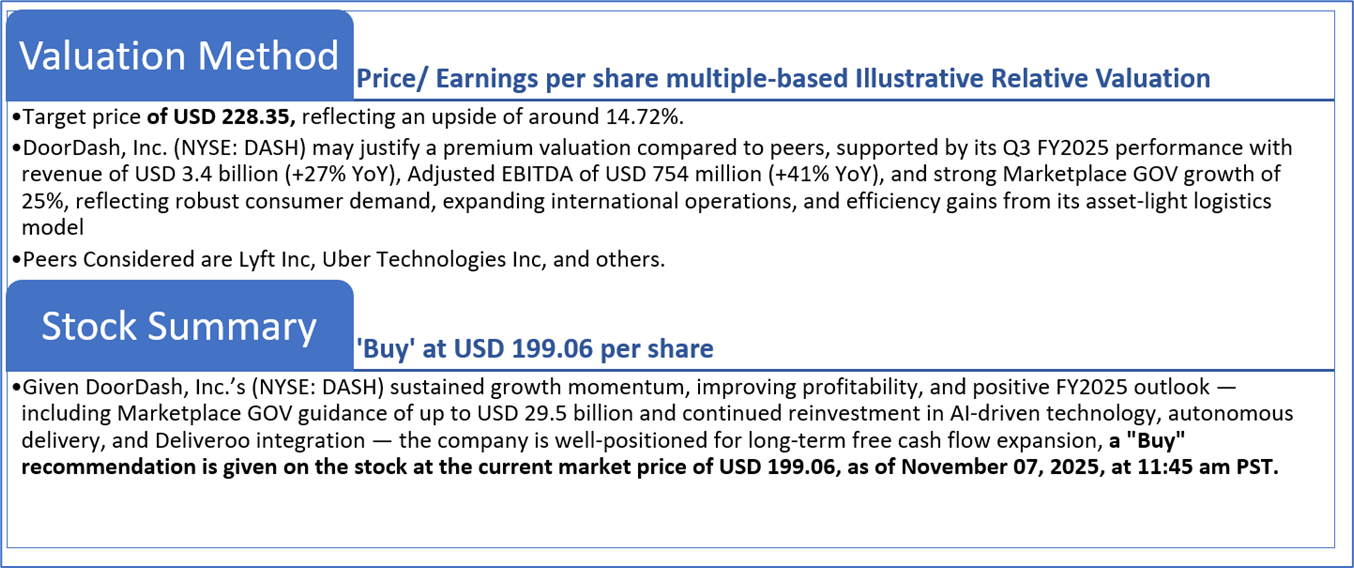
4.2 Fundamental Valuation
Valuation Methodology: Price/Earnings Per Share Multiple Based Relative Valuation
Markets are trading in a highly volatile zone currently due to certain macroeconomic issues and geopolitical tensions prevailing. Therefore, it is prudent to follow a cautious approach while investing.
Note 1: Past performance is not a reliable indicator of future performance.
Note 2: The reference date for all price data, currency, technical indicators, support, and resistance levels is November 07, 2025. The reference data in this report has been partly sourced from REFINITIV.
Note 3: Investment decisions should be made depending on an individual's appetite for upside potential, risks, holding duration, and any previous holdings. An 'Exit' from the stock can be considered if the Target Price mentioned as per the Valuation and or the technical levels provided have been achieved and is subject to the factors discussed above.
Note 4: The report publishing date is as per the Pacific Time Zone.
Technical Indicators Defined: -
Support: A level at which the stock prices tend to find support if they are falling, and a downtrend may take a pause backed by demand or buying interest. Support 1 refers to the nearby support level for the stock and if the price breaches the level, then Support 2 may act as the crucial support level for the stock.
Resistance: A level at which the stock prices tend to find resistance when they are rising, and an uptrend may take a pause due to profit booking or selling interest. Resistance 1 refers to the nearby resistance level for the stock and if the price surpasses the level, then Resistance 2 may act as the crucial resistance level for the stock.
Stop-loss: It is a level to protect against further losses in case of unfavorable movement in the stock prices.
Past performance is not a reliable indicator of future performance.

 Please wait processing your request...