Section 1: Company Overview and Fundamentals
1.1 Company Overview:
Dynatrace, Inc (NYSE: DT) provides an AI-driven observability platform that helps digital enterprises manage complex technology environments and turn that complexity into valuable business insights.
Kalkine’s American Tech Report covers the Company Overview, Key positives & negatives, Investment summary, Key investment metrics, Top 10 shareholding, Business updates and insights into company recent financial results, Key Risks & Outlook, Price performance and technical summary, Target Price, and Recommendation on the stock.
Price Performance:
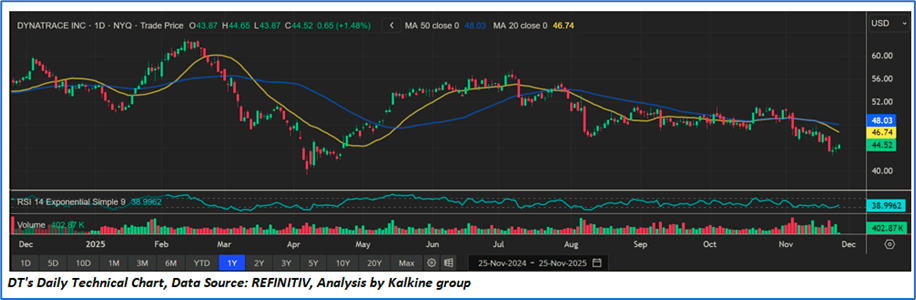
- MA20 is USD 46.74 and MA50 is USD 48.03. The MA20 crossed below the MA50 in late September/early October, forming a bearish crossover, typically a sign of medium-term weakness. Price action remains consistently below both moving averages, reinforcing a bearish bias.
- RSI is 38.96, indicating that the stock is nearing exhaustion on the downside, and a short-term bounce is possible. However, oversold conditions in a downtrend do not guarantee a reversal.
- Volume is steady, indicating bears still control the trend, but without strong momentum—suggesting the downtrend may continue gradually rather than sharply.
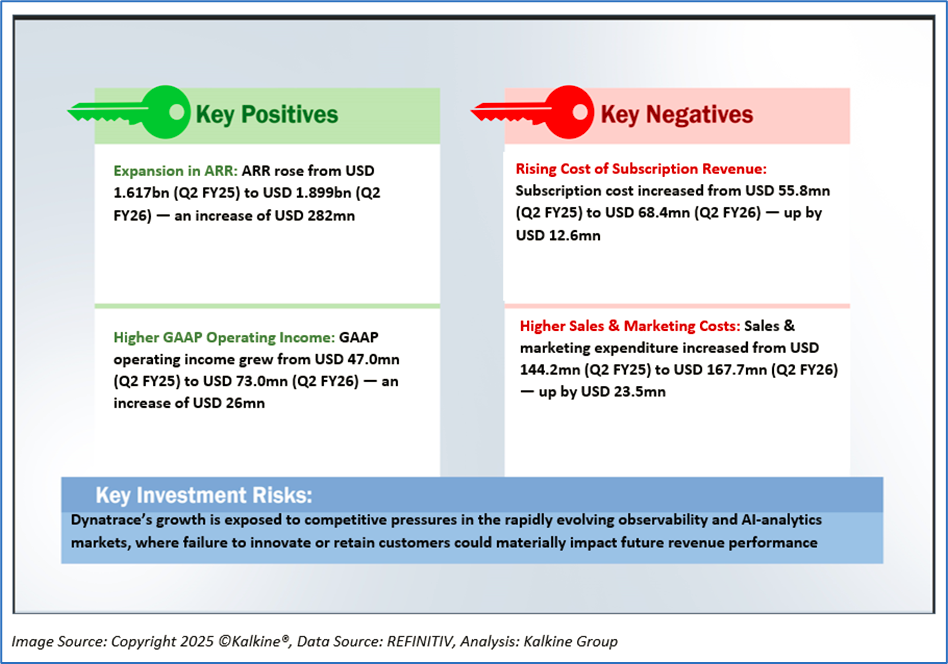
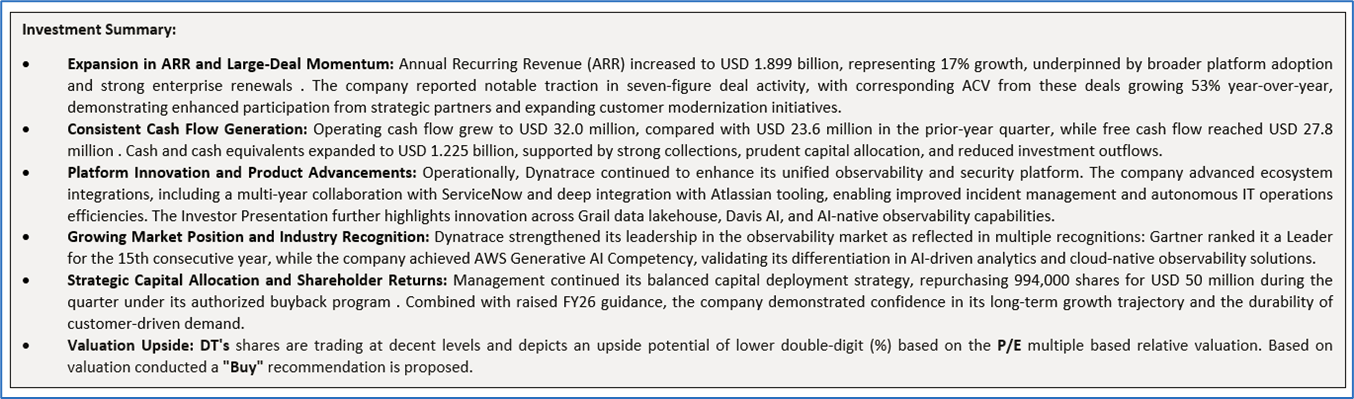
1.2 The Key Positives, Negatives, and Investment summary
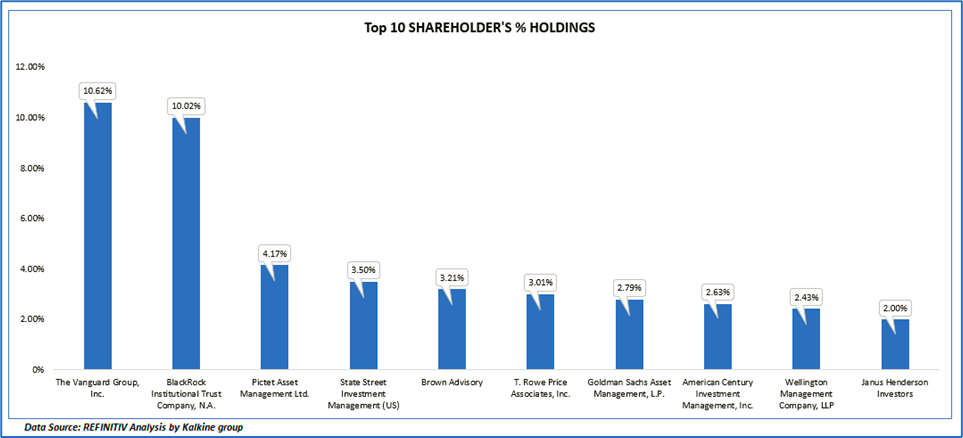
1.3 Top 10 shareholders:
The top 10 shareholders together form ~44.39% of the total shareholding, signifying concentrated shareholding. The Vanguard Group, Inc. and BlackRock Institutional Trust Company, N.A. are the biggest shareholders, holding the maximum stake in the company at ~10.62% and ~10.02%, respectively.
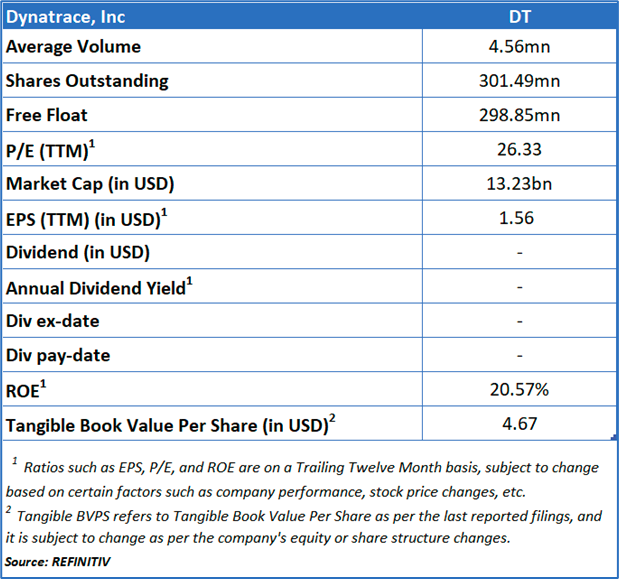
1.4 Key Metrics:
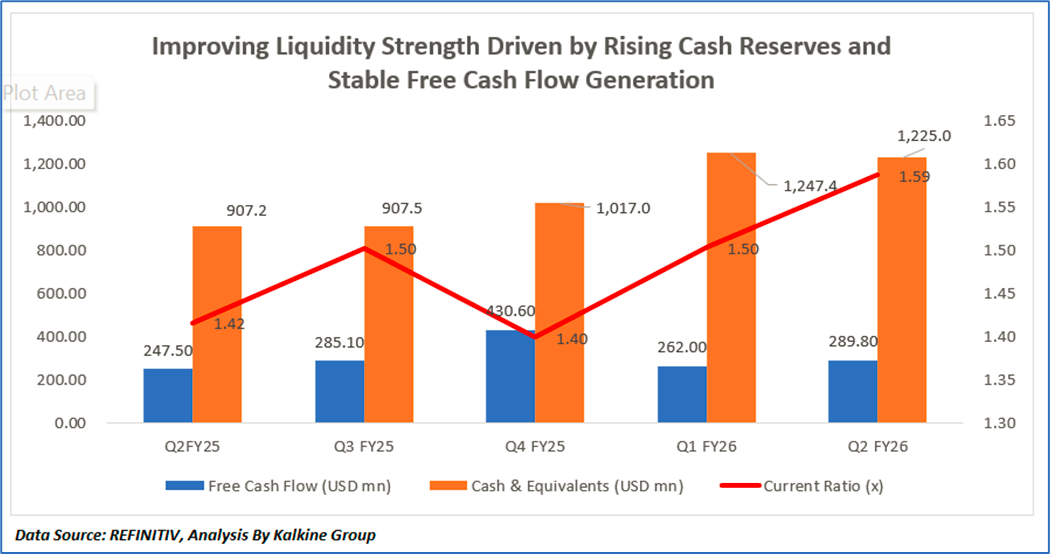
Dynatrace’s liquidity profile strengthened steadily, with cash and equivalents rising from USD 907 million in Q2 FY25 to USD 1,225 million in Q2 FY26, supported by strong operating cash generation driven by higher subscription revenues, improved accounts receivable collections, lower investing outflows, and modest foreign-exchange benefits, all outweighing ongoing share repurchases. Free cash flow fluctuated between USD 247 million, USD 285 million, USD 430 million, USD 262 million, and USD 289.8 million due to quarterly billing seasonality, deferred-revenue movements, and the timing of tax and commission payments, yet remained fundamentally healthy given stable non-GAAP margins and disciplined cost control. The current ratio improved from 1.42 to 1.59, reflecting higher cash balances, a meaningful reduction in short-term liabilities—especially deferred revenue falling from over USD 1,080 million to ~USD 890 million—and continued working-capital optimization. Overall, the interplay of these factors underscores Dynatrace’s growing financial flexibility and the resilience of its subscription-based operating model.
Section 2: Business Updates and Financial Highlights
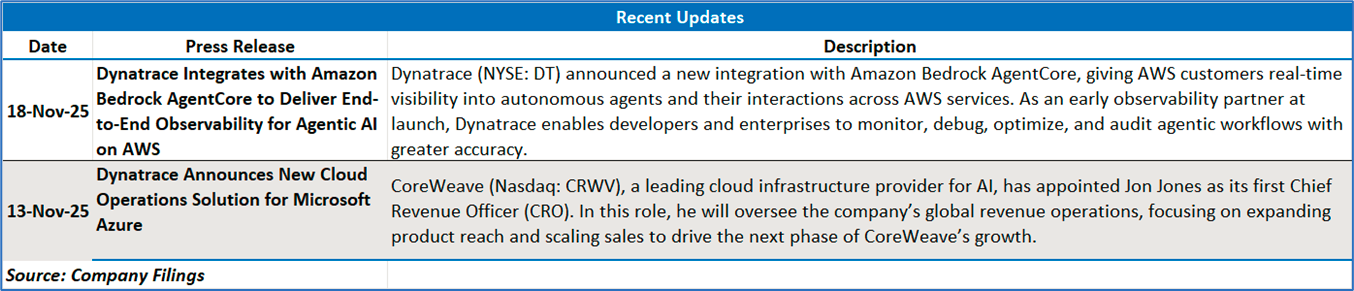
2.1 Recent Updates:
The below picture gives an overview of the recent updates:
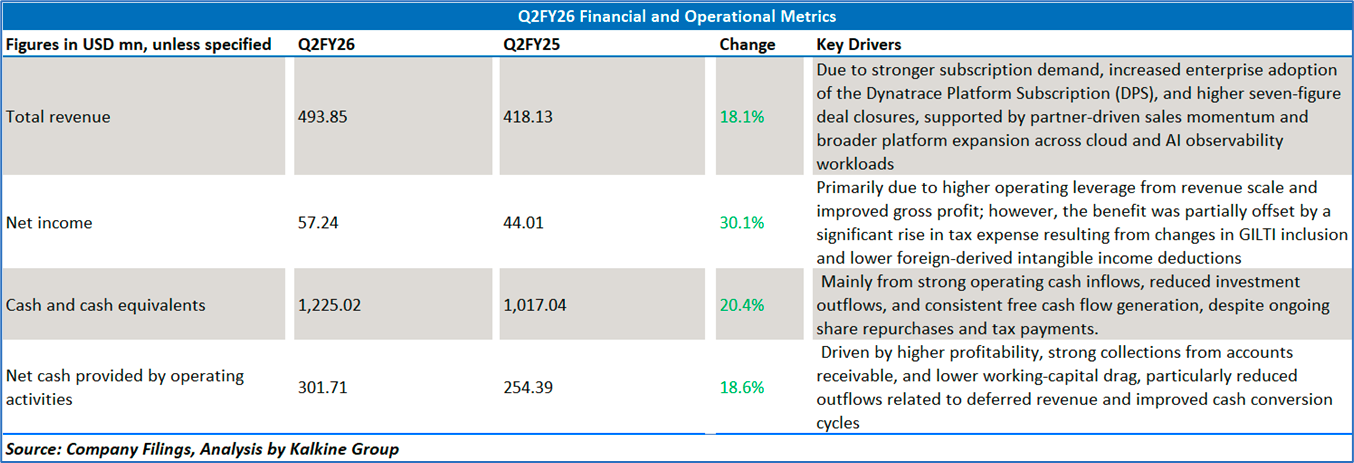
2.2 Insights of Q2FY26:
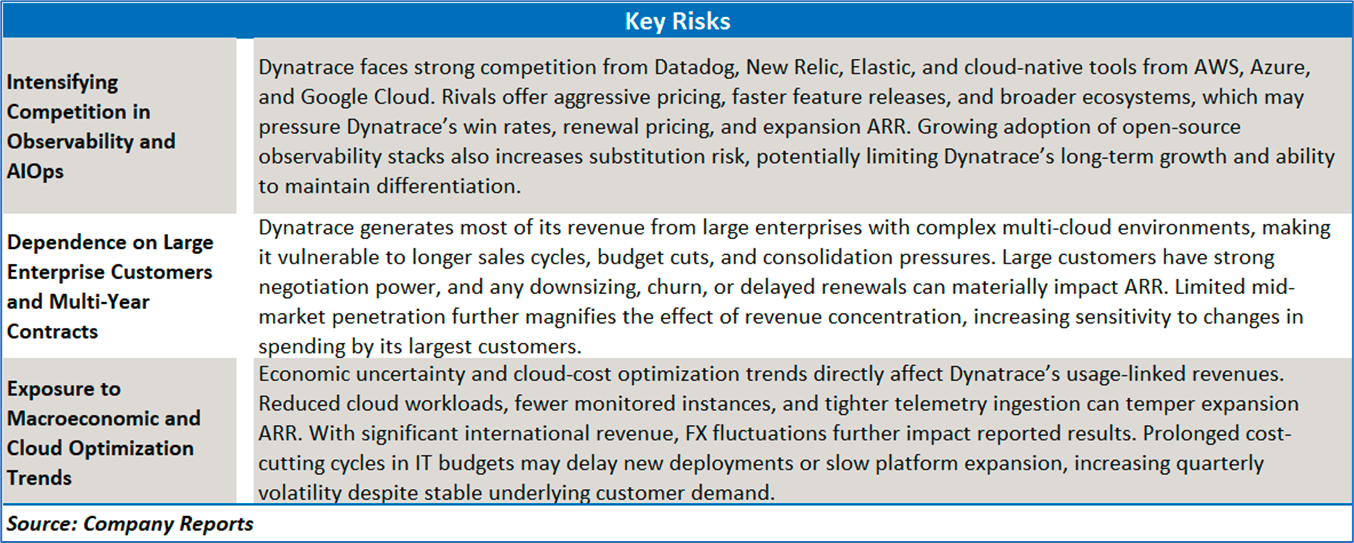
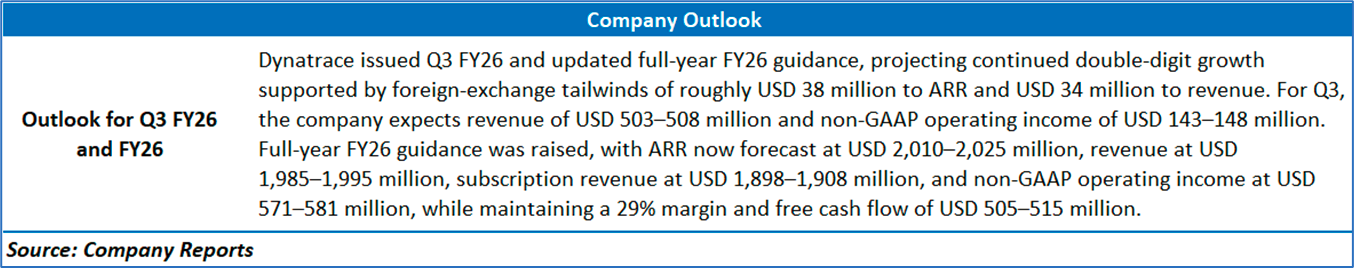
Section 3: Key Risks and Outlook:
Section 4: Stock Recommendation Summary:
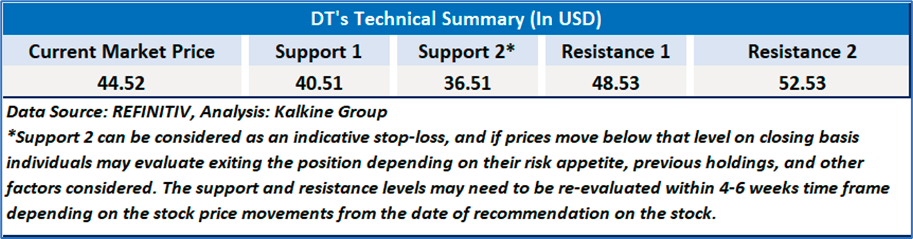
4.1 Technical Summary:
Price Performance:
- MA20 is USD 46.74 and MA50 is USD 48.03. The MA20 crossed below the MA50 in late September/early October, forming a bearish crossover, typically a sign of medium-term weakness. Price action remains consistently below both moving averages, reinforcing a bearish bias.
- RSI is 38.96, indicating that the stock is nearing exhaustion on the downside, and a short-term bounce is possible. However, oversold conditions in a downtrend do not guarantee a reversal.
- Volume is steady, indicating bears still control the trend, but without strong momentum—suggesting the downtrend may continue gradually rather than sharply.
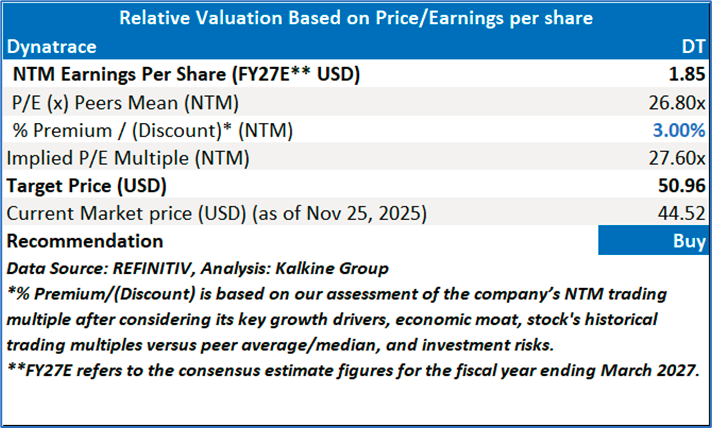
4.2 Fundamental Valuation
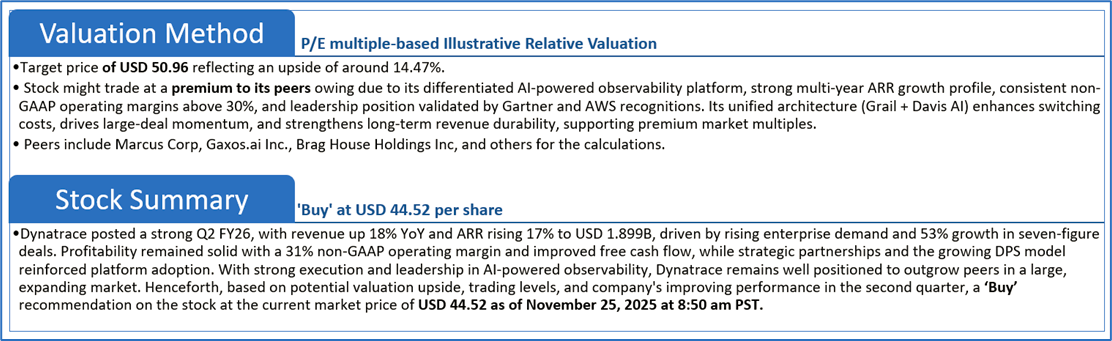
Valuation Methodology: P/E Multiple Based Relative Valuation
Markets are trading in a highly volatile zone currently due to certain macroeconomic issues and geopolitical tensions prevailing. Therefore, it is prudent to follow a cautious approach while investing.
Note 1: Past performance is not a reliable indicator of future performance.
Note 2: The reference date for all price data, currency, technical indicators, support, and resistance levels is November 25, 2025. The reference data in this report has been partly sourced from REFINITIV.
Note 3: Investment decisions should be made depending on an individual's appetite for upside potential, risks, holding duration, and any previous holdings. An 'Exit' from the stock can be considered if the Target Price mentioned as per the Valuation and or the technical levels provided has been achieved and is subject to the factors discussed above.
Note 4: The report publishing date is as per the Pacific Time Zone.
Technical Indicators Defined: -
Support: A level at which the stock prices tend to find support if they are falling, and a downtrend may take a pause backed by demand or buying interest. Support 1 refers to the nearby support level for the stock and if the price breaches the level, then Support 2 may act as the crucial support level for the stock.
Resistance: A level at which the stock prices tend to find resistance when they are rising, and an uptrend may take a pause due to profit booking or selling interest. Resistance 1 refers to the nearby resistance level for the stock and if the price surpasses the level, then Resistance 2 may act as the crucial resistance level for the stock.
Stop-loss: It is a level to protect against further losses in case of unfavorable movement in the stock prices.
Past performance is not a reliable indicator of future performance.

 Please wait processing your request...