Section 1: Company Fundamentals
1.1 Company Overview and Performance summary
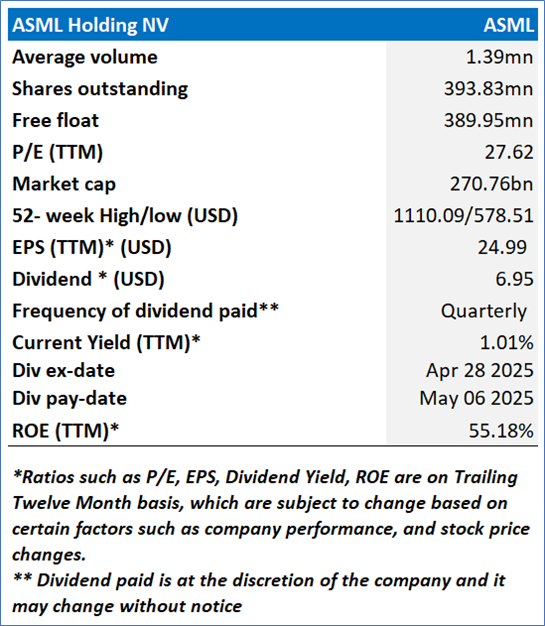
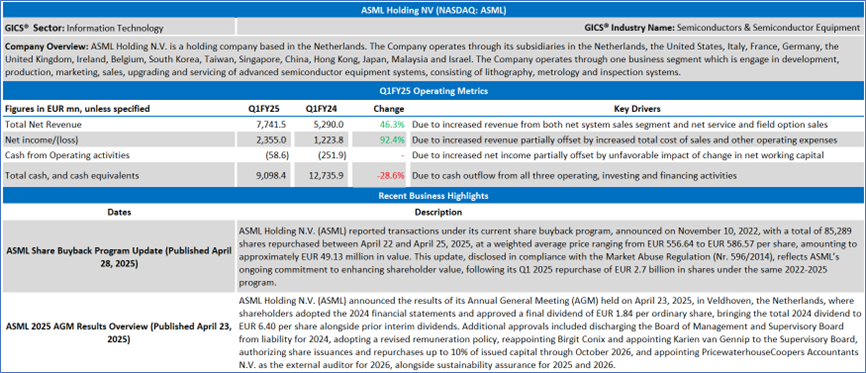
Company Overview:
ASML Holding N.V. (NASDAQ: ASML) is a holding company based in the Netherlands. The Company operates through its subsidiaries in the Netherlands, the United States, Italy, France, Germany, the United Kingdom, Ireland, Belgium, South Korea, Taiwan, Singapore, China, Hong Kong, Japan, Malaysia and Israel. The Company operates through one business segment which is engaged in development, production, marketing, sales, upgrading and servicing of advanced semiconductor equipment systems, consisting of lithography, metrology and inspection systems.
This Global AI and Emerging Market Report covers the Company Overview & Price performance, Summary table, Key positives & negatives, Key metrics, Company details, technical guidance & Stock recommendation, and Price chart.
1.2 Summary Table
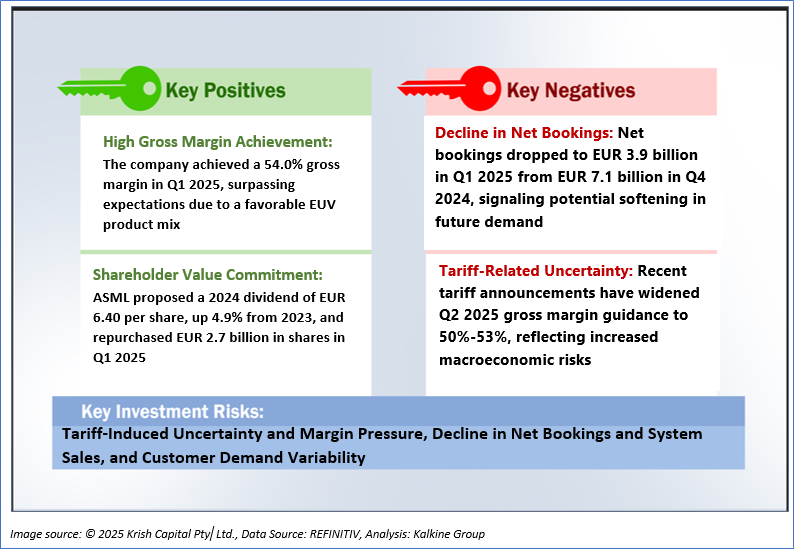
1.3 The Key Positives & Negatives
1.4 Key metrics
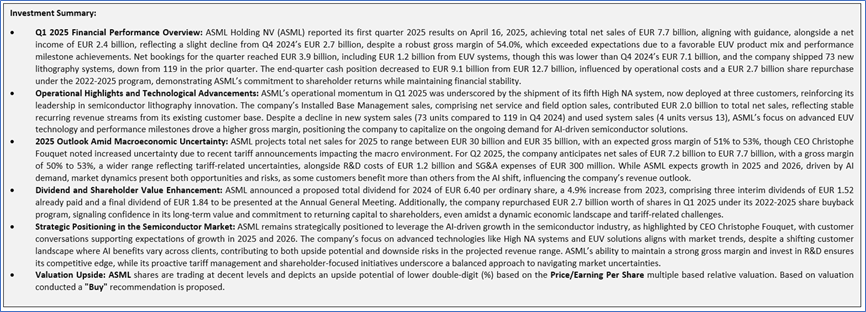
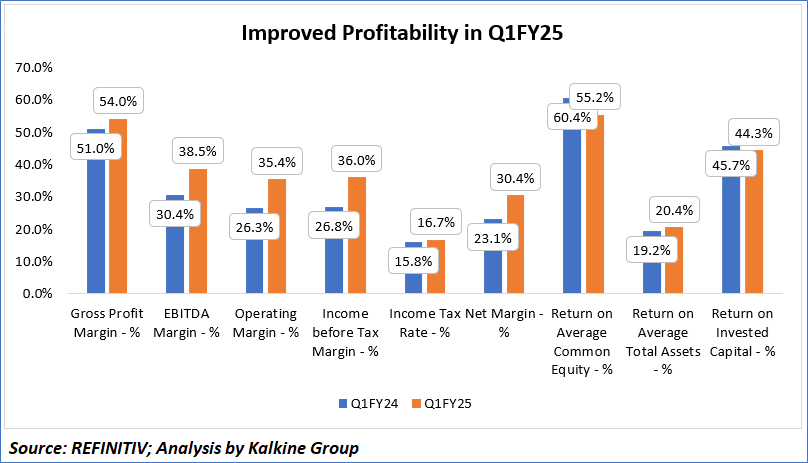
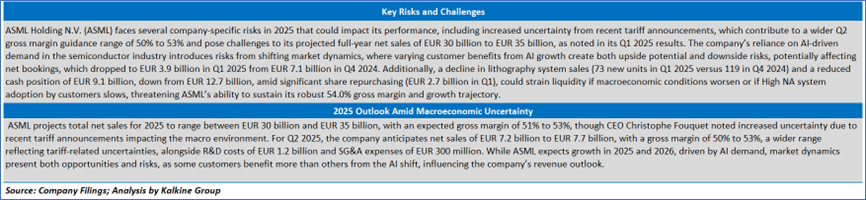
ASML Holding N.V. (ASML) exhibited strong financial growth from 2020 to 2024, with total net sales increasing from EUR 14.0 billion in 2020 to EUR 27.6 billion in 2024, achieving a compound annual growth rate of approximately 18.5%, driven by robust demand for its lithography systems amid the semiconductor industry’s expansion, particularly in AI applications. Gross profit over the same period rose from EUR 6.8 billion to EUR 14.2 billion, with the gross margin improving from 48.6% in 2020 to 51.7% in 2024, reflecting enhanced product mix and operational efficiency, though Q1 2025 showed a further increase to 54.0%, supported by EUV sales. Net income grew from EUR 3.6 billion in 2020 to EUR 7.8 billion in 2024, with the net profit margin slightly contracting from 28.5% in FY23 to 28.3% in FY24 due to rising R&D costs (projected at EUR 1.2 billion for Q2 2025), yet Q1 2025 net income of EUR 2.4 billion underscores sustained profitability despite a decline from Q4 2024’s EUR 2.7 billion. However, challenges persist, as evidenced by a Q1 2025 drop in net bookings to EUR 3.9 billion from EUR 7.1 billion and a reduced cash position of EUR 9.1 billion from EUR 12.7 billion, influenced by a EUR 2.7 billion share repurchase, highlighting potential liquidity risks amid tariff uncertainties and market variability in the AI-driven semiconductor landscape.
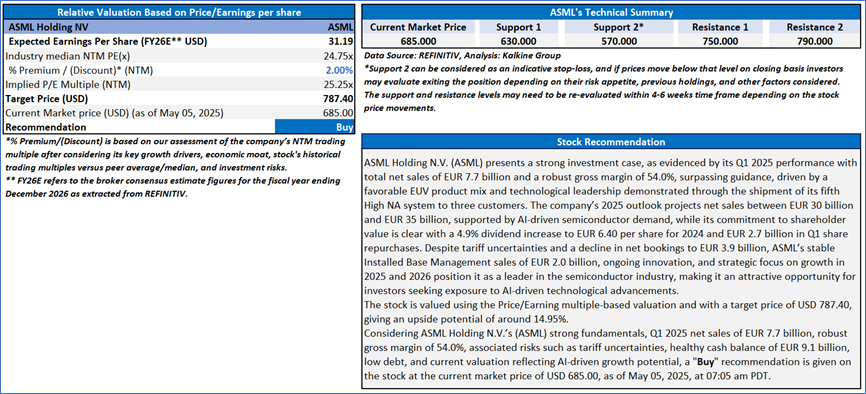
Section 2: ASML Holding NV (NASDAQ: ASML) (“Buy” at the current market price of USD 685.00, as of May 05, 2025, at 07:05 am PDT)
2.1 Company Details
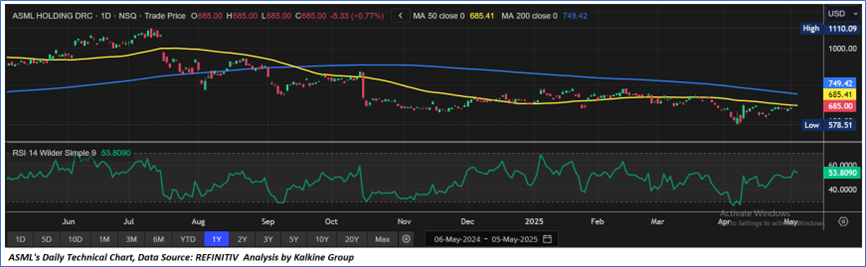
2.2 Technical Guidance and Stock Recommendation
Clearwater Analytics Holdings Inc (NYSE: CWAN)
Section 1: Company Fundamentals
1.1 Company Overview and Performance summary
Company Overview:
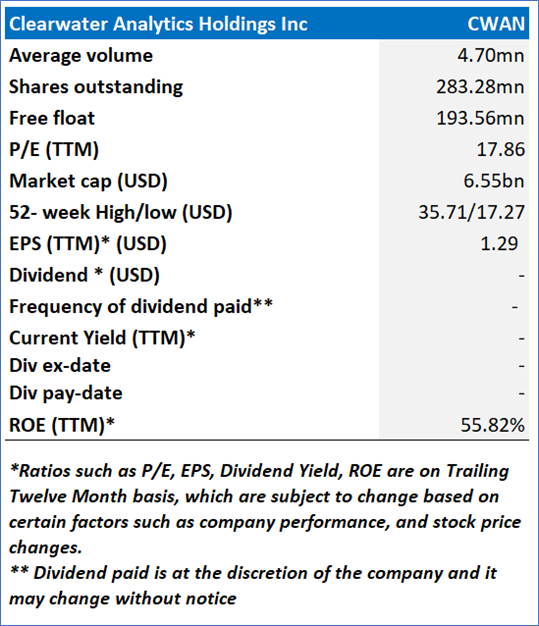
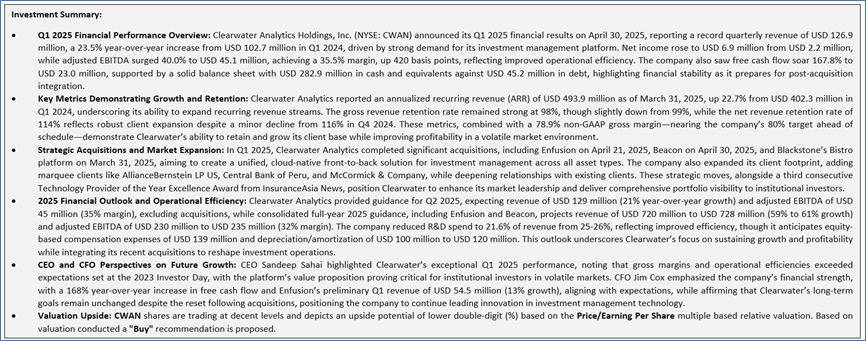
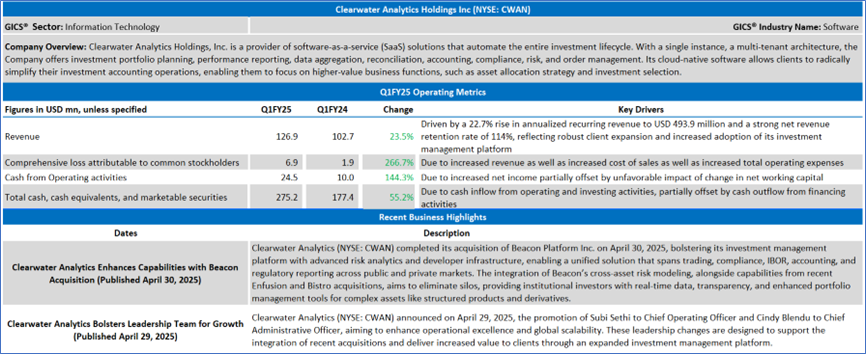
Clearwater Analytics Holdings, Inc. (NYSE: CWAN) is a provider of software-as-a-service (SaaS) solutions that automate the entire investment lifecycle. With a single instance, a multi-tenant architecture, the Company offers investment portfolio planning, performance reporting, data aggregation, reconciliation, accounting, compliance, risk, and order management. Its cloud-native software allows clients to radically simplify their investment accounting operations, enabling them to focus on higher-value business functions, such as asset allocation strategy and investment selection.
This Global AI and Emerging Market Report covers the Company Overview & Price performance, Summary table, Key positives & negatives, Key metrics, Company details, technical guidance & Stock recommendation, and Price chart.
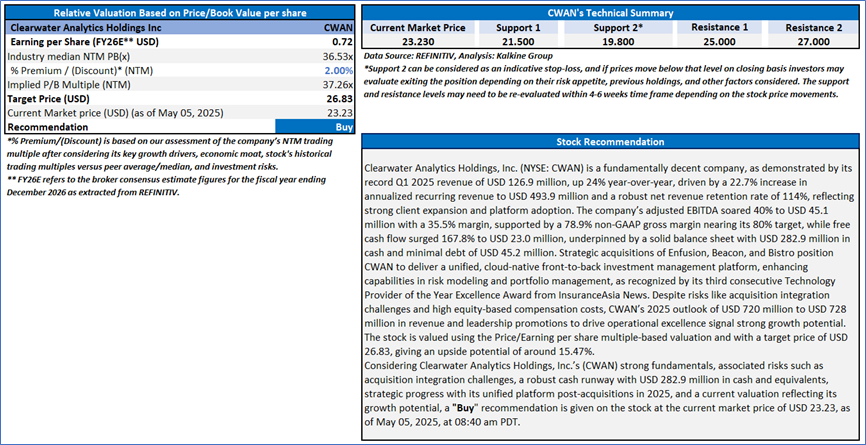
1.2 Summary Table
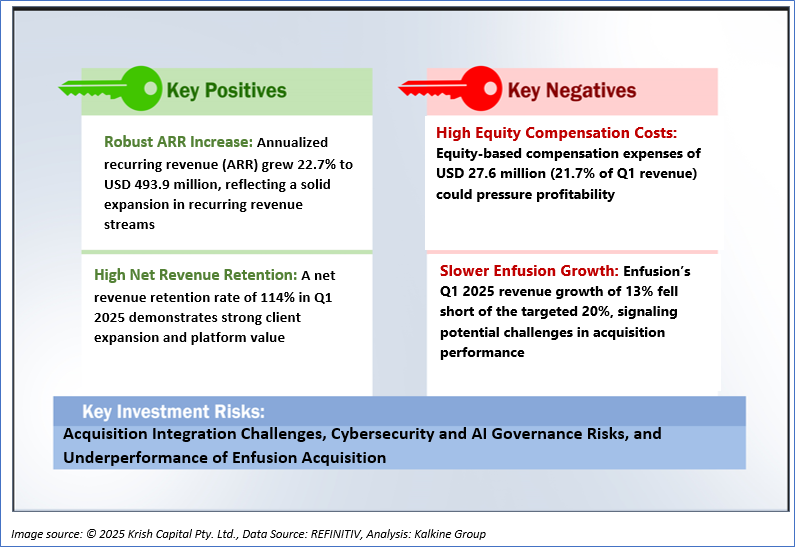
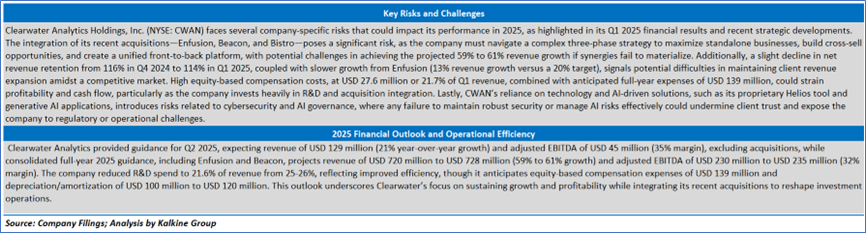
1.3 The Key Positives & Negatives
Section 2: Clearwater Analytics Holdings Inc (NYSE: CWAN) (“Buy” at the current market price of USD 23.23, as of May 05, 2025, at 08:40 am PDT)
2.1 Company Details
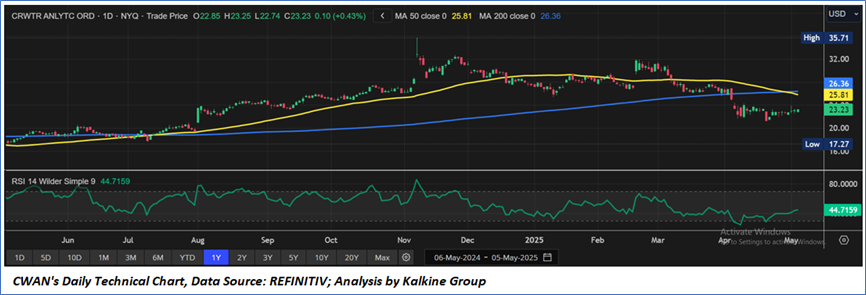
2.2 Technical Guidance and Stock Recommendation
Markets are trading in a highly volatile zone currently due to certain macroeconomic issues and geopolitical tensions prevailing. Therefore, it is prudent to follow a cautious approach while investing.
Note 1: Past performance is not a reliable indicator of future performance.
Note 2: The reference date for all price data, currency, technical indicators, support, and resistance levels is May 05, 2025. The reference data in this report has been partly sourced from REFINITIV.
Note 3: Investment decisions should be made depending on an individual's appetite for upside potential, risks, holding duration, and any previous holdings. An 'Exit' from the stock can be considered if the Target Price mentioned as per the Valuation and or the technical levels provided has been achieved and is subject to the factors discussed above.
Note 4: The report publishing date is as per the Pacific Time Zone.
Technical Indicators Defined: -
Support: A level at which the stock prices tend to find support if they are falling, and a downtrend may take a pause backed by demand or buying interest. Support 1 refers to the nearby support level for the stock and if the price breaches the level, then Support 2 may act as the crucial support level for the stock.
Resistance: A level at which the stocks prices tend to find resistance when they are rising, and an uptrend may take a pause due to profit booking or selling interest. Resistance 1 refers to the nearby resistance level for the stock and if the price surpasses the level, then Resistance 2 may act as the crucial resistance level for the stock.
Stop-loss: It is a level to protect against further losses in case of unfavorable movement in the stock prices.
Past performance is not a reliable indicator of future performance.

 Please wait processing your request...