Section 1: Company Overview and Fundamentals
1.1 Company Overview:
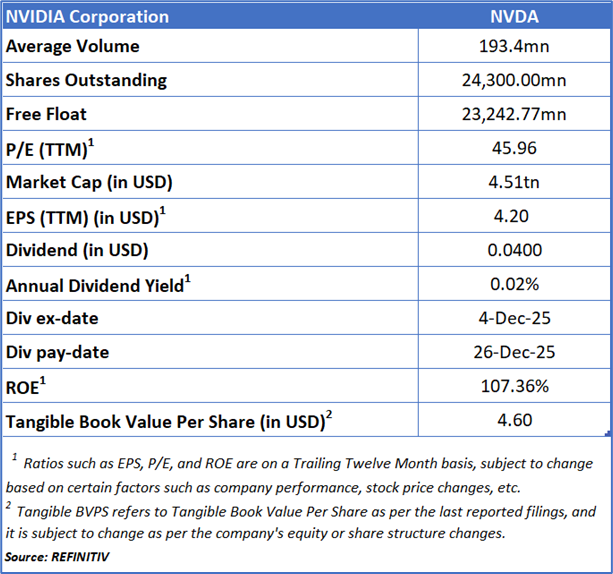
NVIDIA Corporation (NASDAQ: NVDA) is a leading U.S.-based semiconductor and AI computing company known for its high-performance GPUs and data-center platforms. Its business spans AI accelerators, cloud computing systems, gaming GPUs, professional visualization, and autonomous-vehicle technology. NVIDIA’s CUDA software ecosystem, advanced chip architecture, and dominance in AI hardware position it as a core infrastructure provider for global AI development, powering hyperscalers, enterprises, and next-generation intelligent systems.
Kalkine’s American Tech Report covers the Company Overview, Key positives & negatives, Investment summary, Key investment metrics, Top 10 shareholding, Business updates and insights into company recent financial results, Key Risks & Outlook, Price performance and technical summary, Target Price, and Recommendation on the stock.
Price Performance:
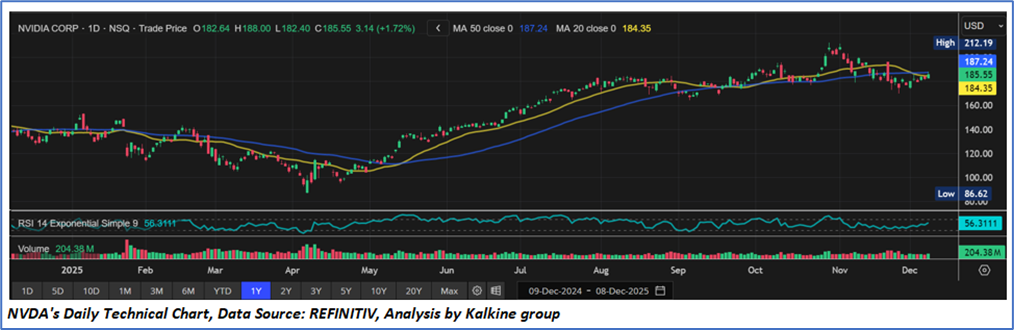
- The chart shows a clear medium-term uptrend, with steady gains from early 2025 and a peak near USD 212 in late October. Price action has moved into a sideways consolidation, easing modestly after strong prior gains.
- The stock is currently trading around the 20-day and 50-day moving averages, which have flattened and signal a pause in momentum.
- RSI is neutral (mid-50s), indicating neither overbought nor oversold conditions and a balanced near-term outlook.
- The broader bias remains constructively bullish, but a clearer upside signal would require a break above USD 190–195, while support sits near USD 180.
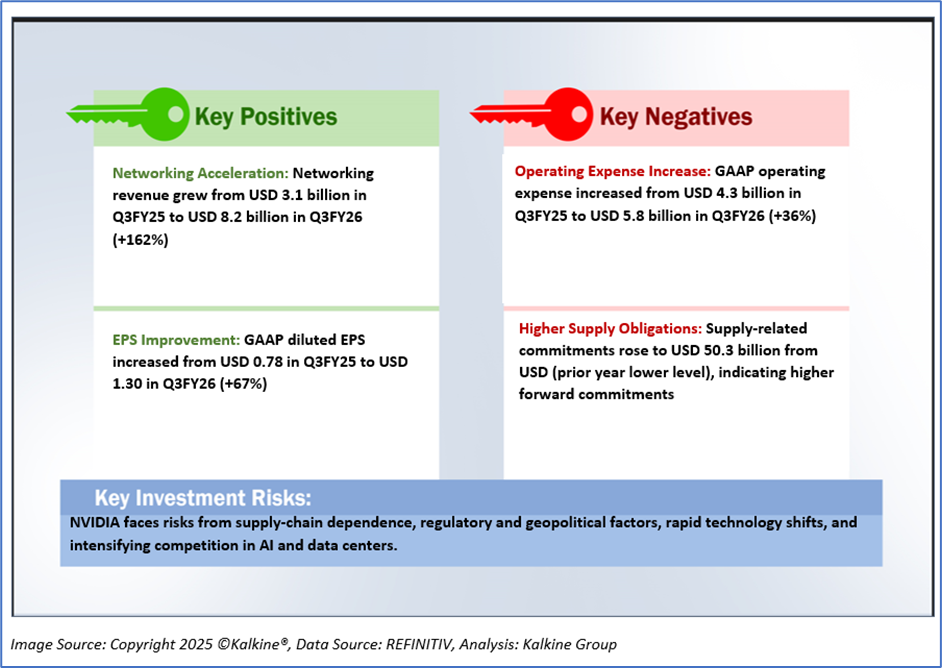
1.2 The Key Positives, Negatives, and Investment summary
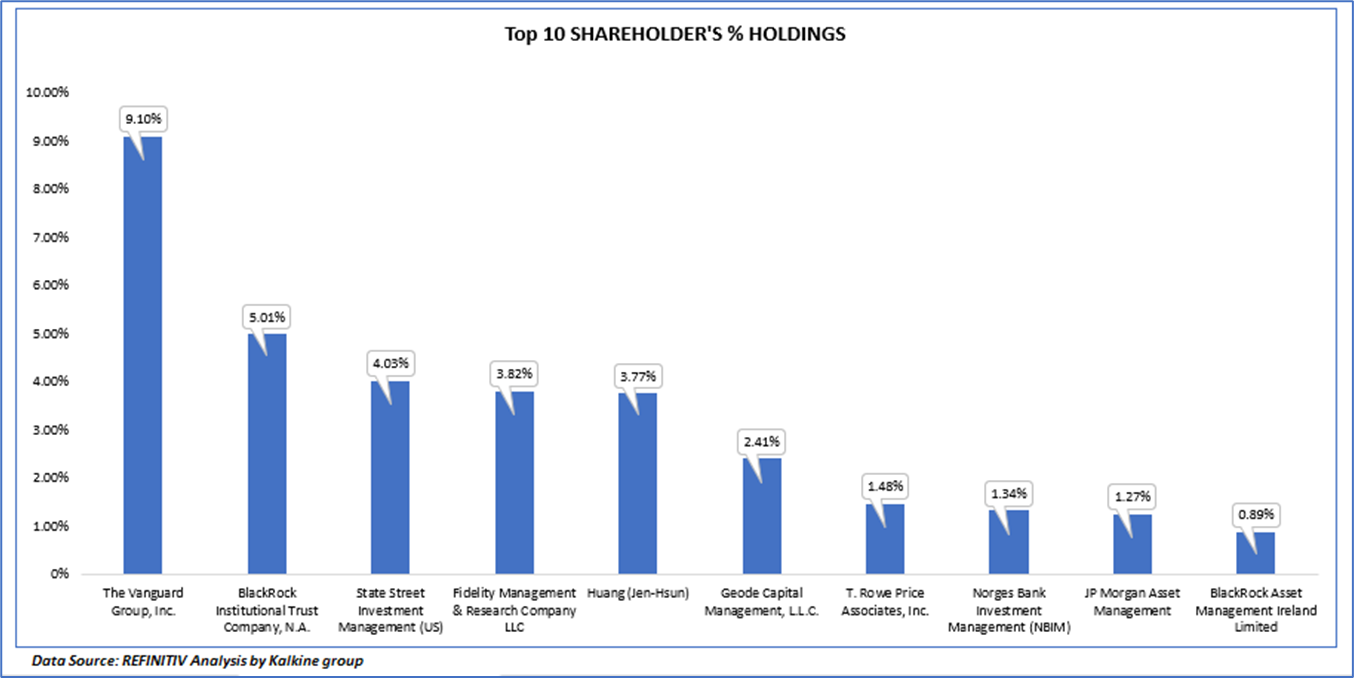
1.3 Top 10 shareholders:
The top 10 shareholders together form ~33.13% of the total shareholding, signifying concentrated shareholding. The Vanguard Group, Inc. and BlackRock Institutional Trust Company, N.A. are the biggest shareholders, holding the maximum stake in the company at ~9.10% and ~5.01%, respectively.
1.4 Key Metrics:
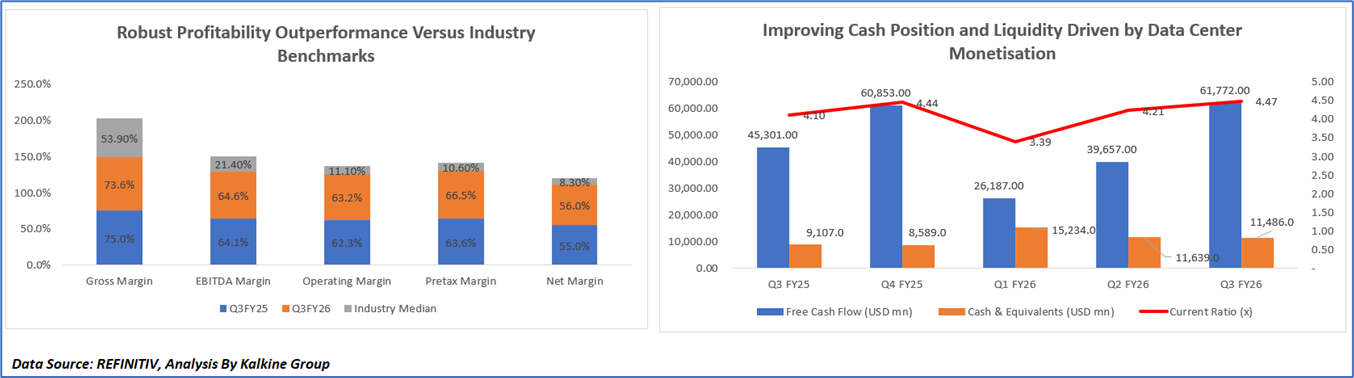
The fluctuations in Free Cash Flow, Cash & Equivalents, and the Current Ratio across the periods shown primarily reflect NVIDIA’s front-loaded supply chain investments followed by accelerating monetisation. The dip in Q1 FY26 was driven by increased inventory purchases, long-lead component commitments, and infrastructure spending linked to the Blackwell transition, which temporarily weighed on free cash flow despite strong profitability. Subsequently, robust Data Center revenue and higher operating cash generation in Q2 and Q3 supported a strong rebound, while variations in cash balances were partly influenced by sizeable share repurchases and dividends. The improvement in the Current Ratio through FY26 indicates strengthening liquidity and balance-sheet capacity as operating cash flows scaled, demonstrating the company’s ability to convert platform demand into financial resilience.
Further, the profitability trend shows that most metrics improved in Q3 FY26 versus Q3 FY25, with NVIDIA sustaining levels well above the wider industry median. The slight compression in gross margin primarily reflects the shift from Hopper HGX systems toward full-scale Blackwell data-center solutions, which initially carried a different cost mix, although margins improved sequentially as Blackwell ramped and delivered better cost efficiency. EBITDA, operating, pretax and net margins strengthened due to exceptional revenue expansion in Data Center compute and networking, strong operating leverage from scaling volumes, and higher other income linked to gains on non-marketable and publicly-held equity securities. Despite higher operating expenses associated with engineering development, infrastructure compute and employee growth, the company’s ability to convert accelerating AI demand into earnings materially outpaced cost increases. Collectively, these dynamics reinforced NVIDIA’s premium profitability profile relative to peers, underscoring its full-stack leadership in accelerated computing and AI infrastructure
Section 2: Business Updates and Financial Highlights
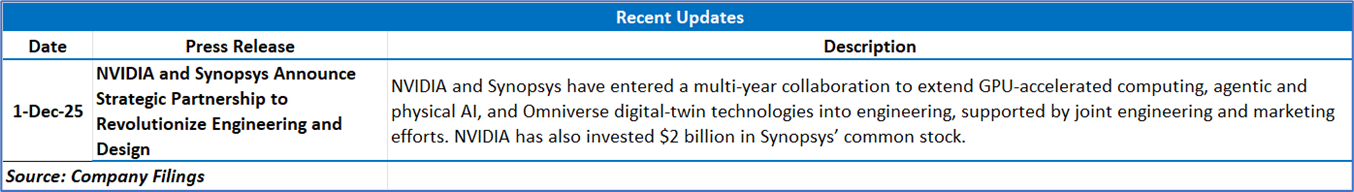
2.1 Recent Updates:
The below picture gives an overview of the recent updates:
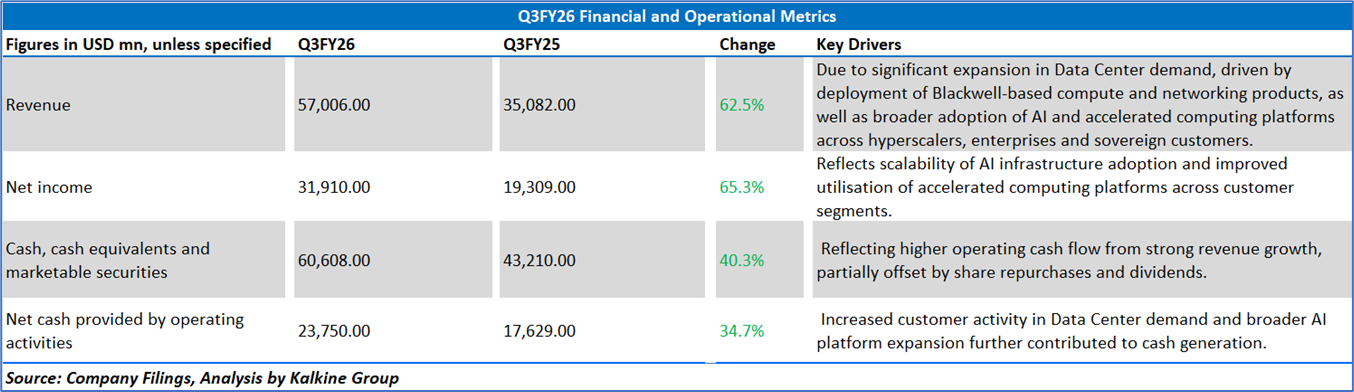
2.2 Insights of Q3FY26:
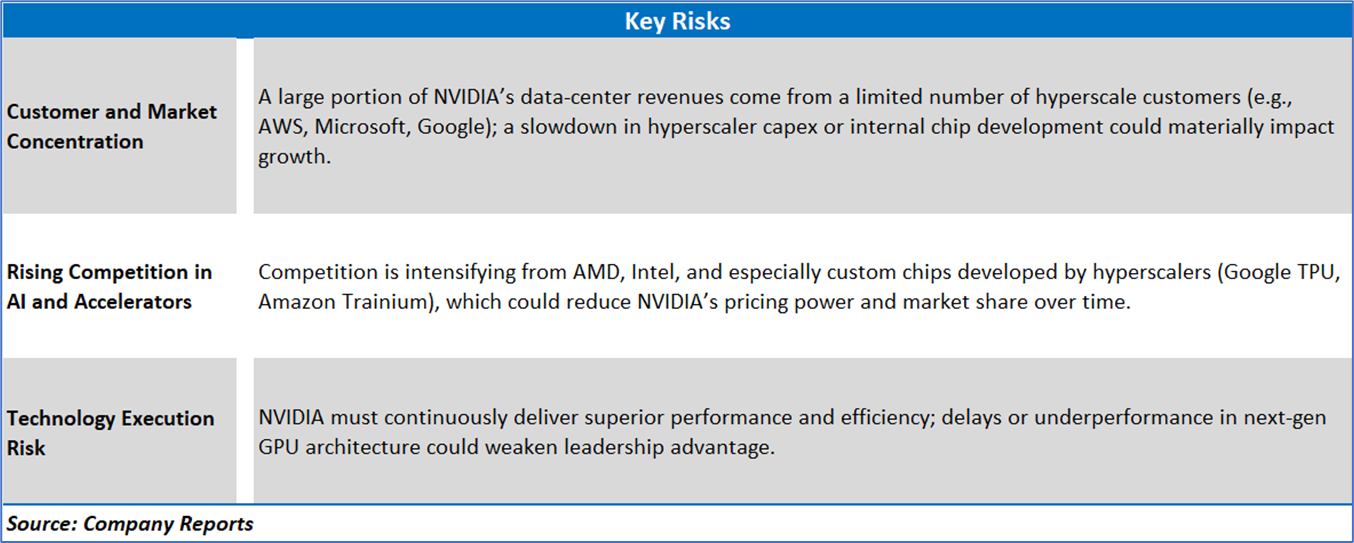
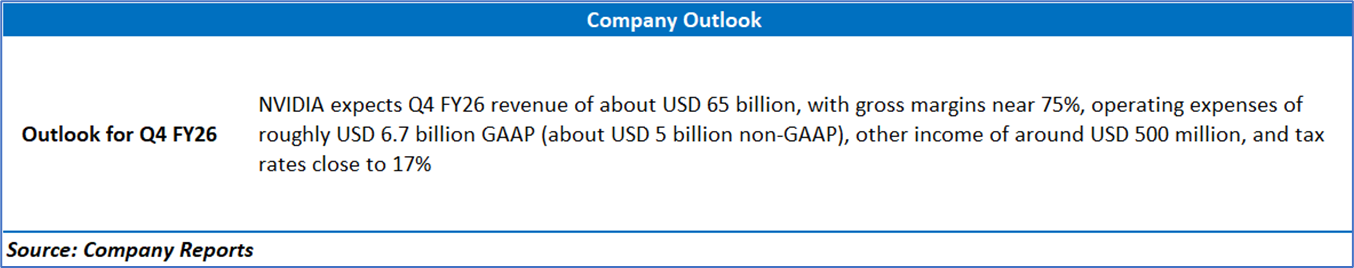
Section 3: Key Risks and Outlook:
Section 4: Stock Recommendation Summary:
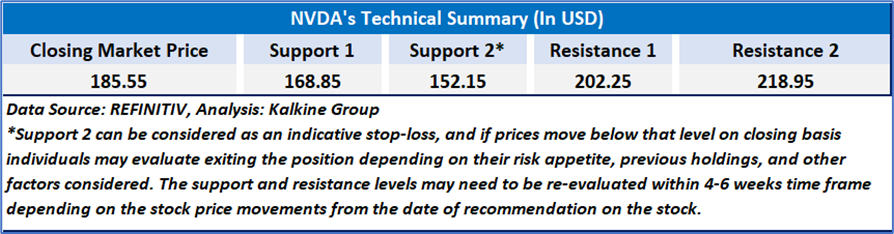
4.1 Technical Summary:
Price Performance:
- The chart shows a clear medium-term uptrend, with steady gains from early 2025 and a peak near USD 212 in late October. Price action has moved into a sideways consolidation, easing modestly after strong prior gains.
- The stock is currently trading around the 20-day and 50-day moving averages, which have flattened and signal a pause in momentum.
- RSI is neutral (mid-50s), indicating neither overbought nor oversold conditions and a balanced near-term outlook.
- The broader bias remains constructively bullish, but a clearer upside signal would require a break above USD 190–195, while support sits near USD 180.
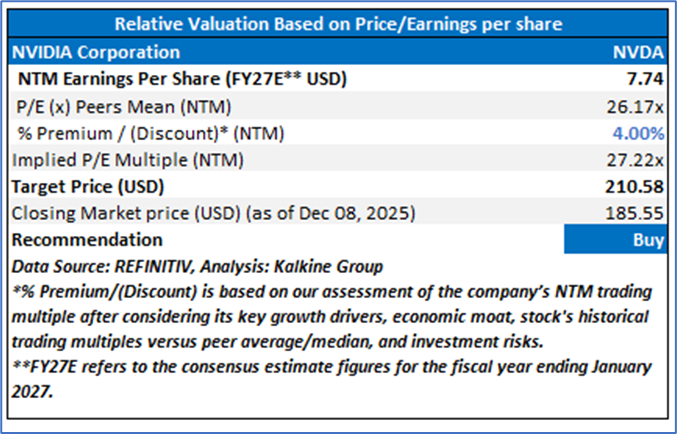
4.2 Fundamental Valuation
Valuation Methodology: Price-to-Earnings (P/E) Multiple Based Relative Valuation
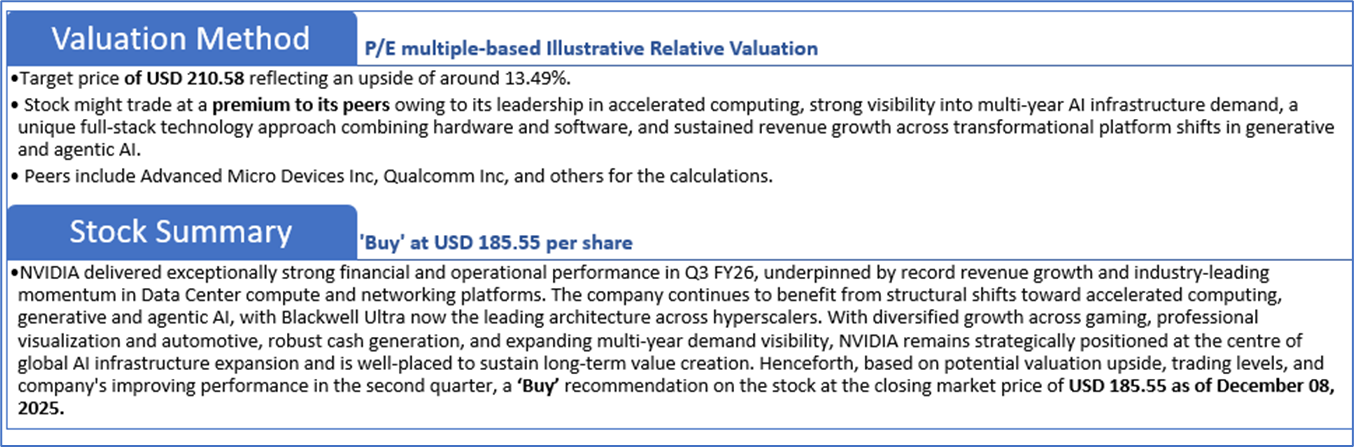
Markets are trading in a highly volatile zone currently due to certain macroeconomic issues and geopolitical tensions prevailing. Therefore, it is prudent to follow a cautious approach while investing.
Note 1: Past performance is not a reliable indicator of future performance.
Note 2: The reference date for all price data, currency, technical indicators, support, and resistance levels is December 08, 2025. The reference data in this report has been partly sourced from REFINITIV.
Note 3: Investment decisions should be made depending on an individual's appetite for upside potential, risks, holding duration, and any previous holdings. An 'Exit' from the stock can be considered if the Target Price mentioned as per the Valuation and or the technical levels provided has been achieved and is subject to the factors discussed above.
Note 4: The report publishing date is as per the Pacific Time Zone.
Technical Indicators Defined: -
Support: A level at which the stock prices tend to find support if they are falling, and a downtrend may take a pause backed by demand or buying interest. Support 1 refers to the nearby support level for the stock and if the price breaches the level, then Support 2 may act as the crucial support level for the stock.
Resistance: A level at which the stock prices tend to find resistance when they are rising, and an uptrend may take a pause due to profit booking or selling interest. Resistance 1 refers to the nearby resistance level for the stock and if the price surpasses the level, then Resistance 2 may act as the crucial resistance level for the stock.
Stop-loss: It is a level to protect against further losses in case of unfavorable movement in the stock prices.
Past performance is not a reliable indicator of future performance.

 Please wait processing your request...