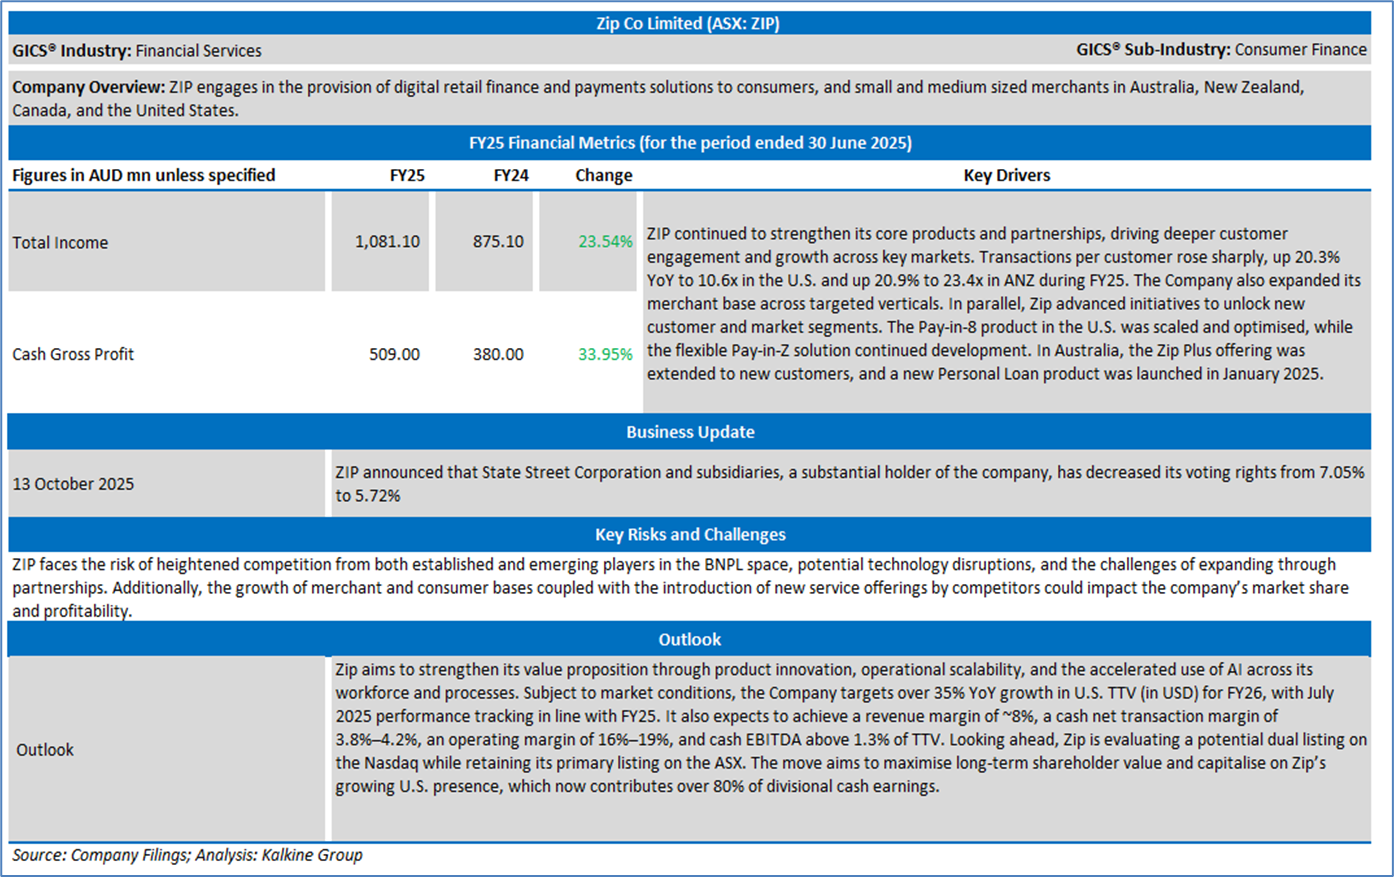
Company Overview: Overview: Zip Co Limited (ASX: ZIP) engages in the provision of digital retail finance and payments solutions to consumers, and small and medium sized merchants in Australia, New Zealand, Canada, and the United States. Nuix Limited (ASX: NXL) is a provider of investigative analytics and intelligence software that helps customers uncover truth in the digital world. The company enables efficient collection, processing, and review of vast structured and unstructured data. Nuix delivers scalable, fast, and forensically accurate insights for informed decision-making. This Global Artificial Intelligence & Emerging Technologies Report covers the Investment Highlights, Key Financial Metrics, Risks, Outlook, Technical Analysis along with the Valuation, Target Price, and Recommendation on these two stocks.
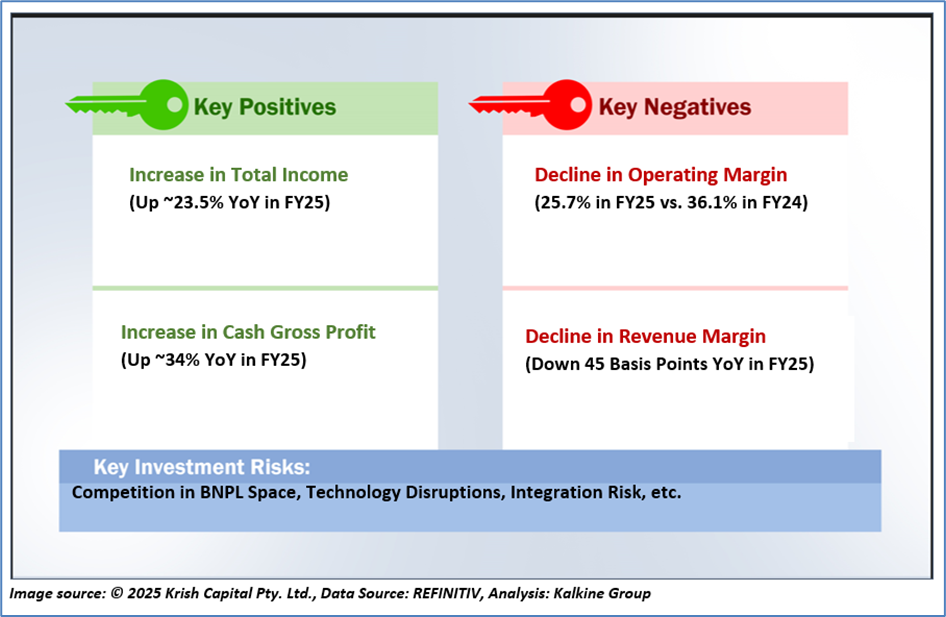
Section 1.0: Key Metrics in Pictures
Having looked at the key financial metrics above the below sections provide in-depth fundamental, and technical analysis on this AI-based Stock along with recommendation, technical support, and resistance level & indicative stop-loss.
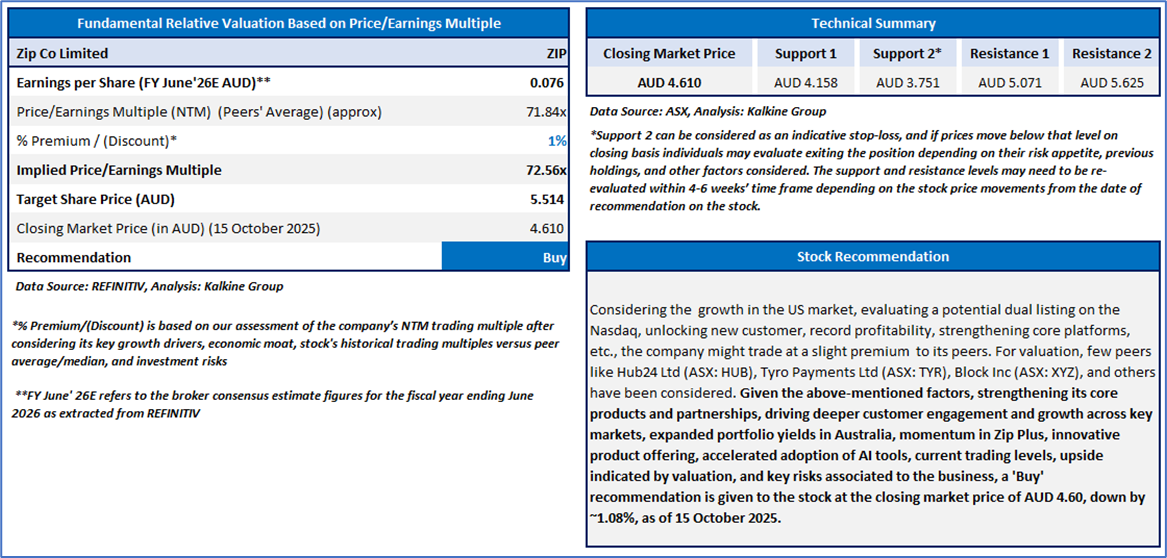
Section 2.0: Zip Co Limited (ASX: ZIP) (‘Buy’ at AUD 4.640 at closing market price per share as on 15 October 2025)
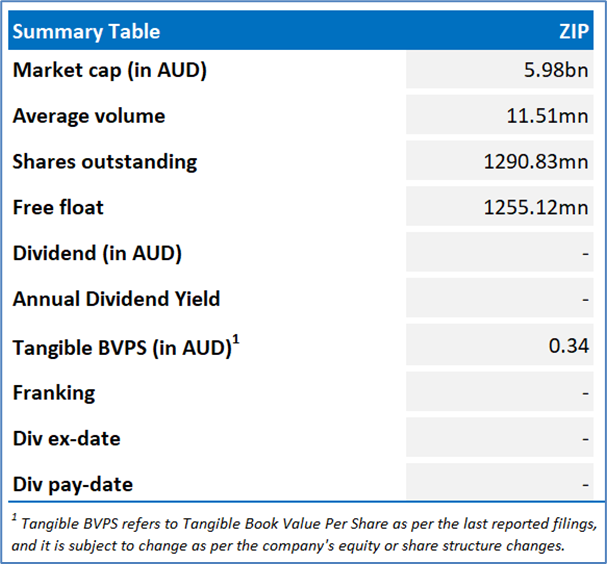
2.1 Company Details
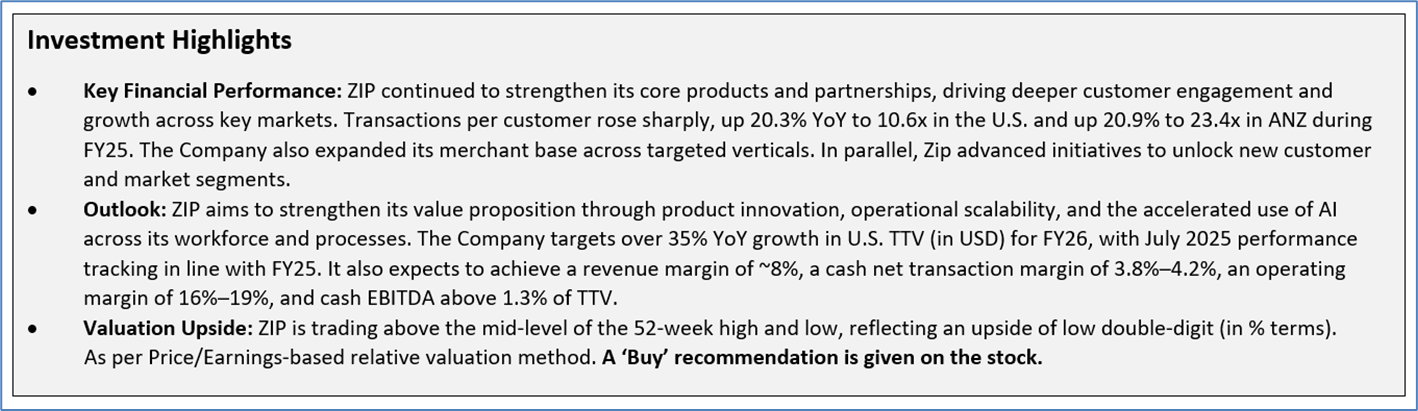
2.2 Valuation, Technical Summary & Stock Recommendation
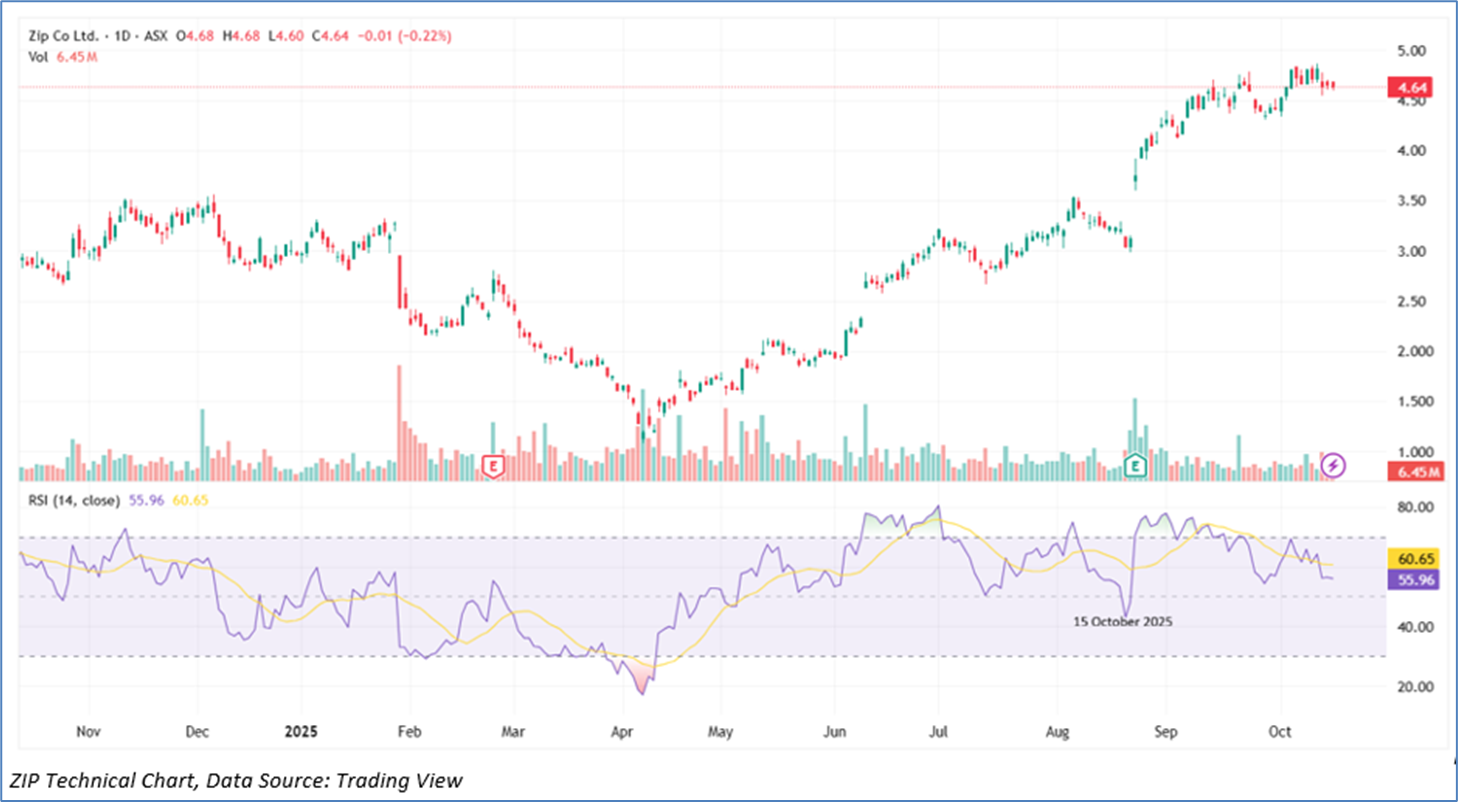
The stock has gone up by ~2.65% in the last 1 month, and over the past three months, it has increased by ~62.8%. The stock has a 52-week low and 52-week high of AUD 1.085 and AUD 4.860, respectively, and is currently trading above the 52-week high-low average. ZIP was last covered in a report dated ’24 September 2025’.
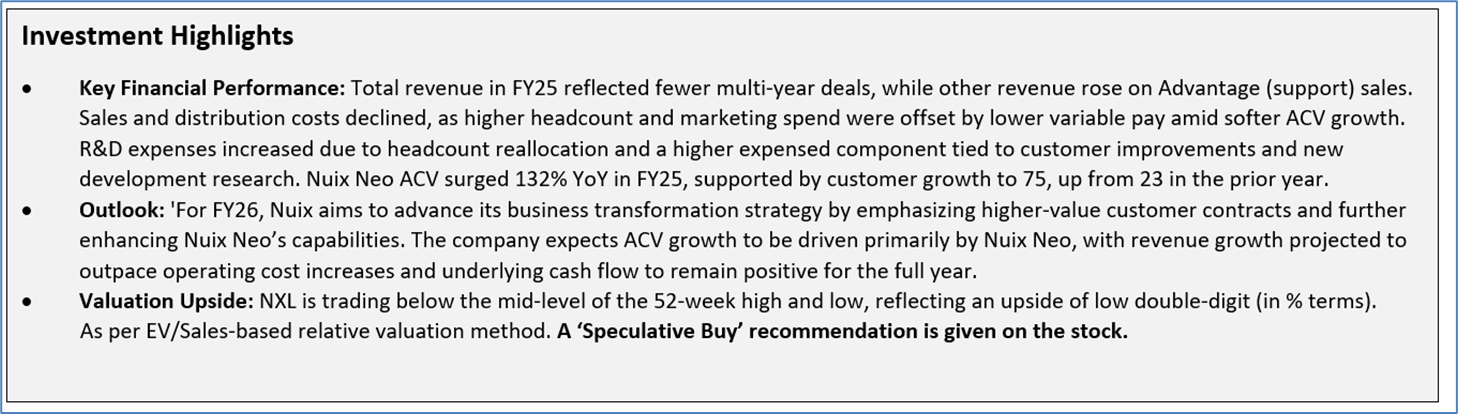
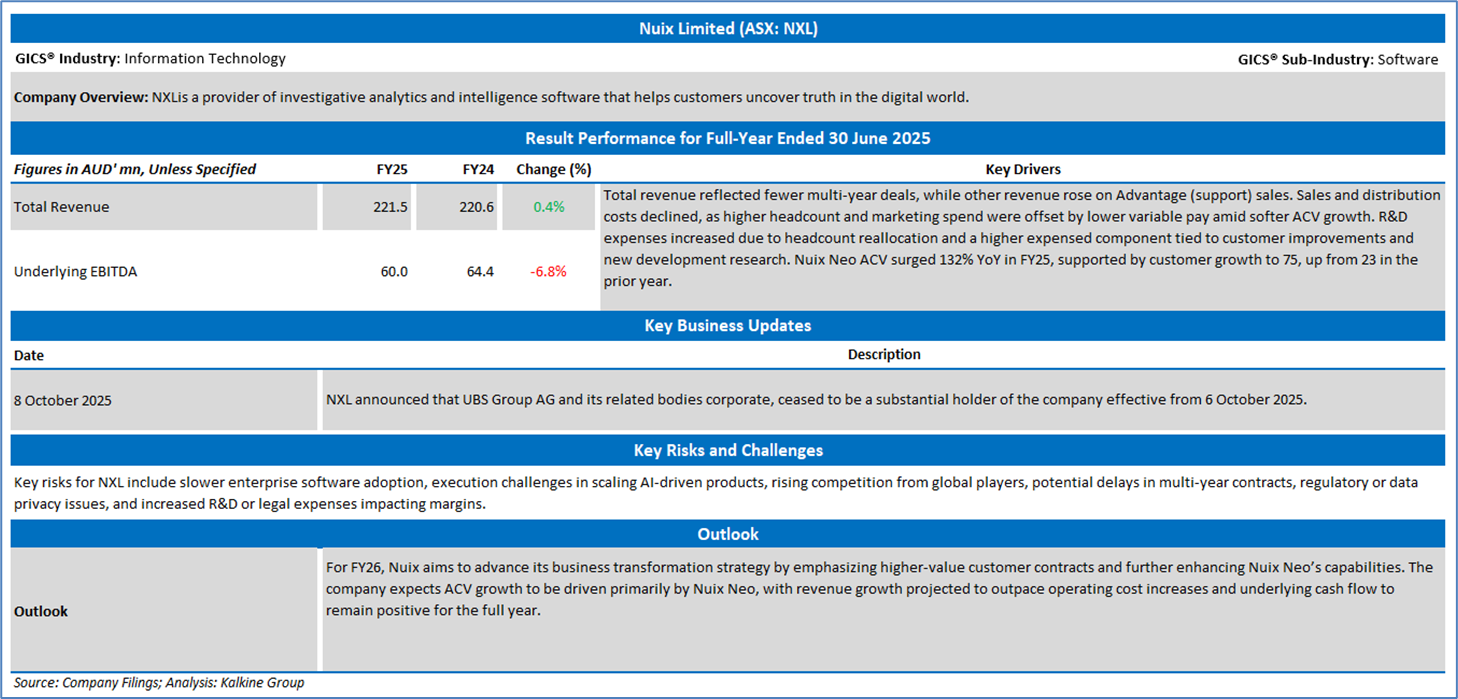
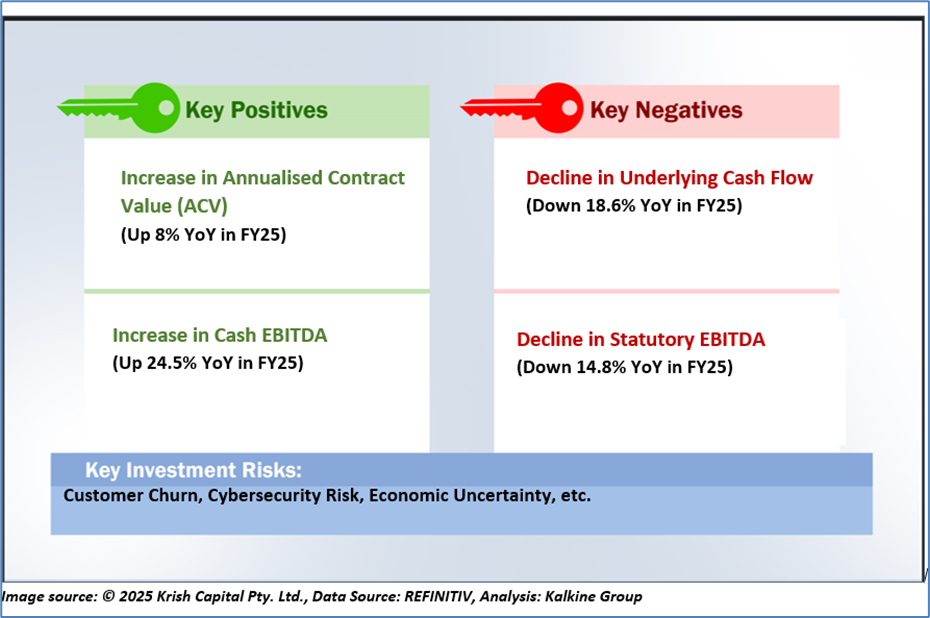
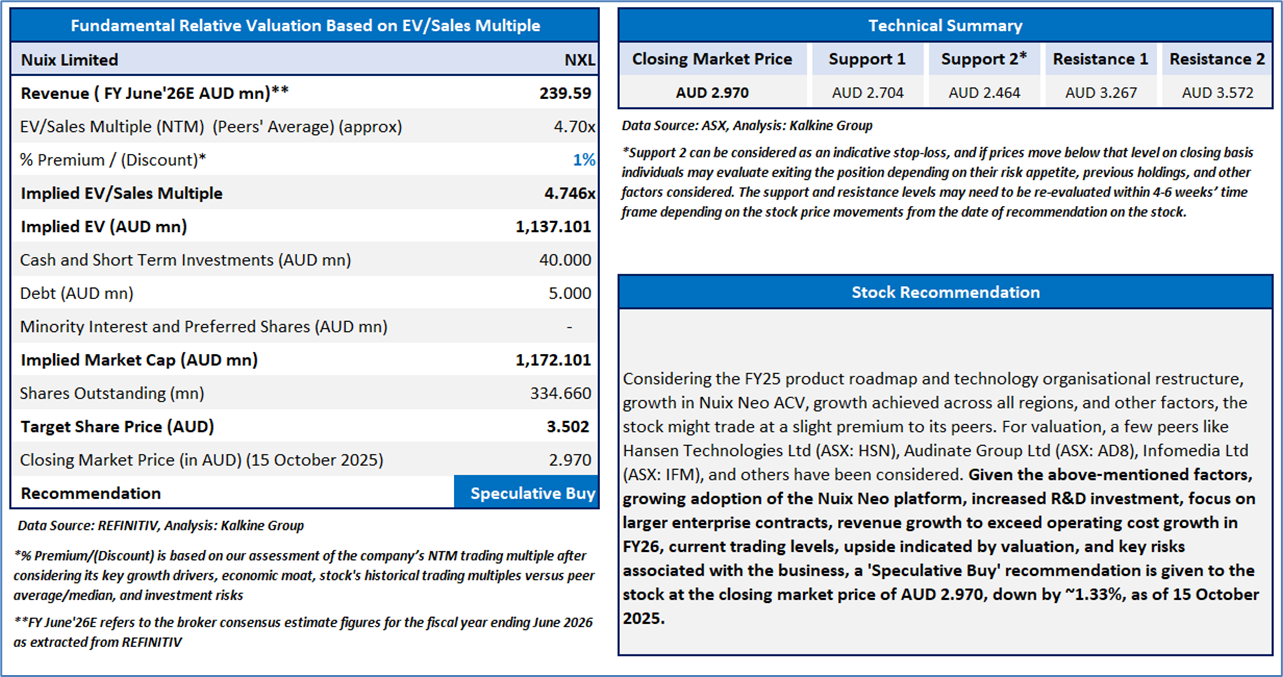
Nuix Limited (ASX: NXL)
Section 3.0: Key Metrics in Pictures
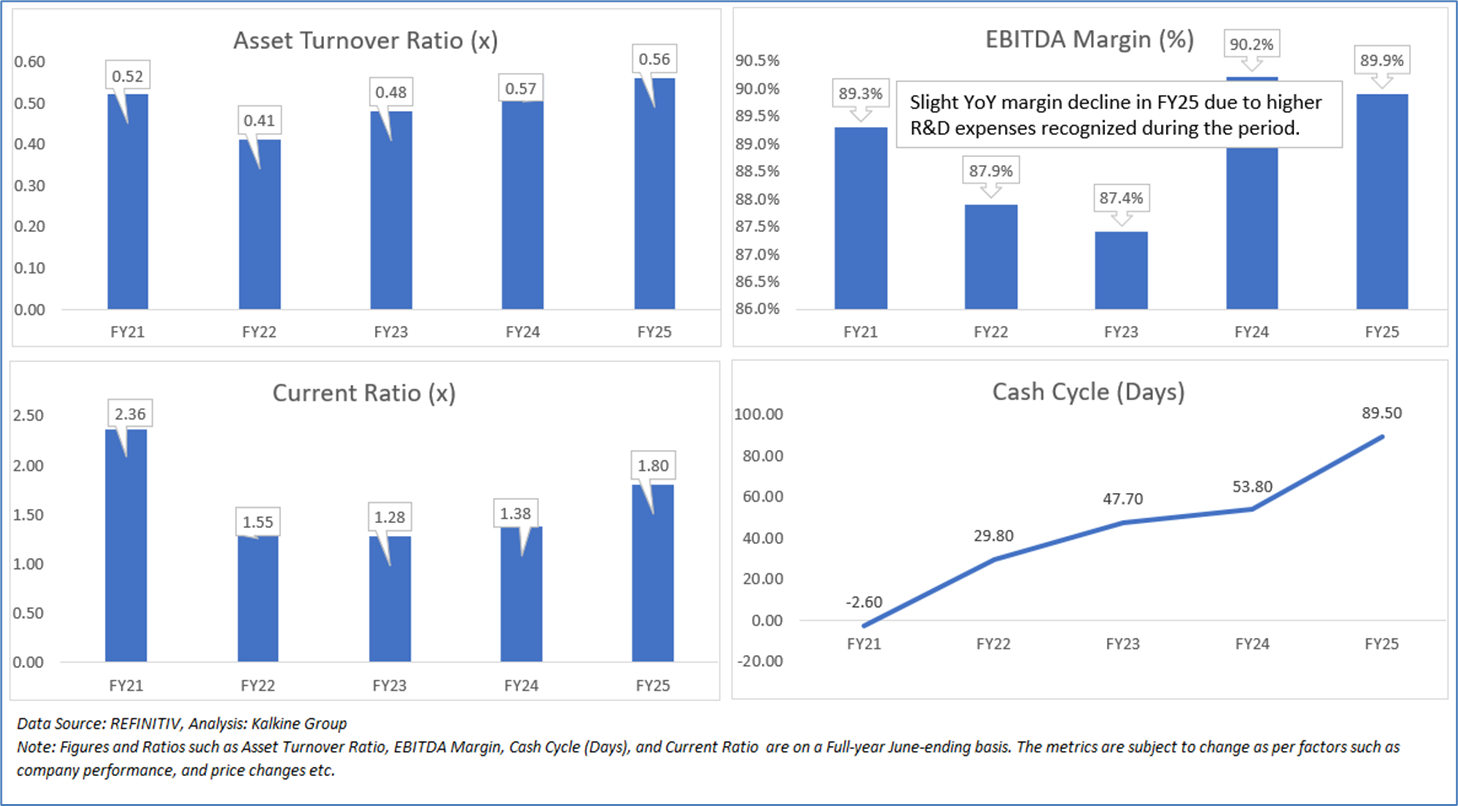
Having looked at the key financial metrics above the below sections provide in-depth fundamental, and technical analysis on this AI-Based Stock along with recommendation, technical support, and resistance level & indicative stop-loss.
Section 4.0: Nuix Limited (ASX: NXL) (‘Speculative Buy’ at AUD 2.970, closing market price per share as on 15 October 2025)
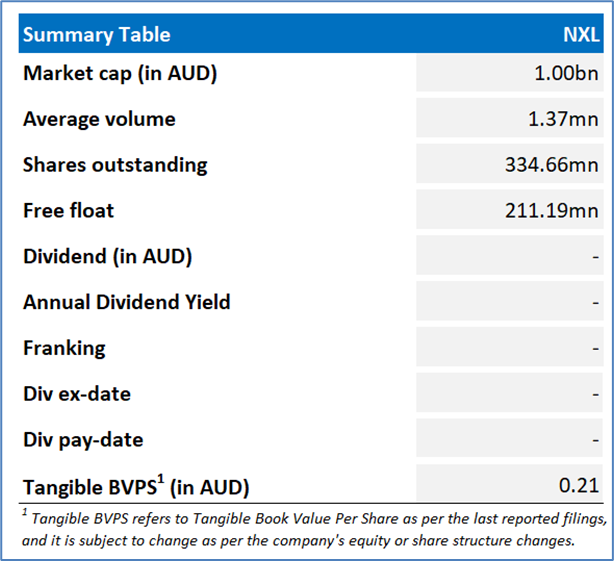
4.1 Company Details
4.2 Valuation, Technical Summary & Stock Recommendation
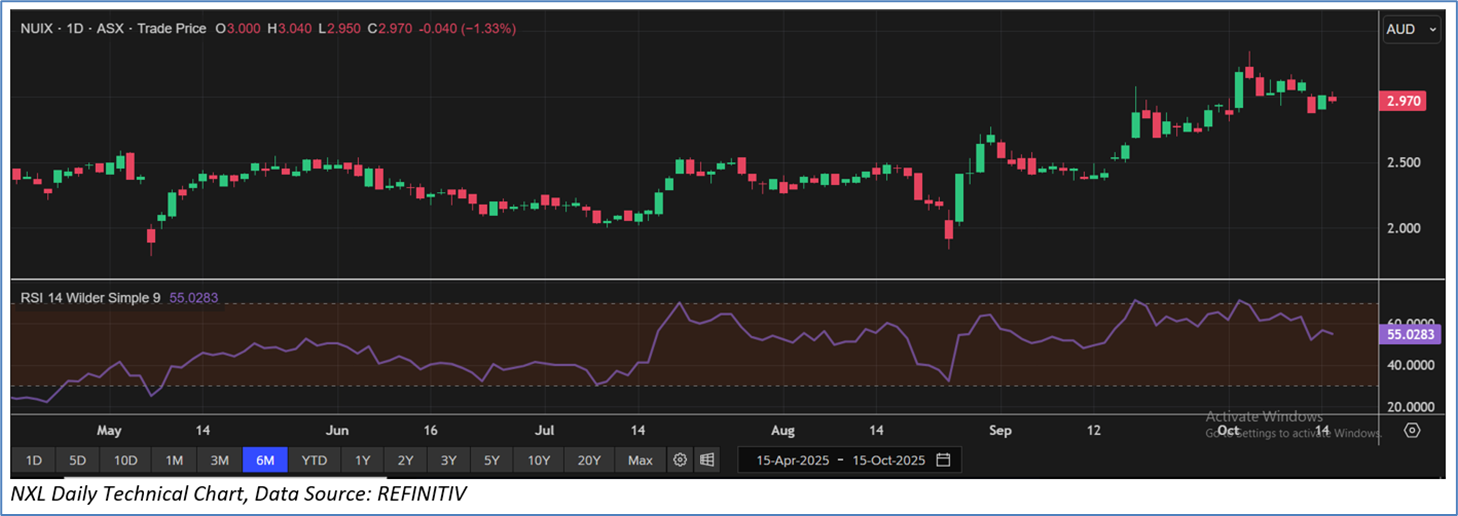
The stock price has gone down up ~24.8% in the last six months and whereas over the last one year, stock prices declined by ~58.1%. The stock has a 52-week low and 52-week high of AUD 1.785 and AUD 7.850, respectively, and is currently trading below the average of the 52-week-high-low levels. NXL was last covered in a report dated ’18 September 2025’.
Markets are trading in a highly volatile zone currently due to certain macro-economic issues and geopolitical issues prevailing geopolitical tensions. Therefore, it is prudent to follow a cautious approach while investing.
Note 1: Past performance is neither an indicator nor a guarantee of future performance.
Note 2: The reference date for all price data, currency, technical indicators, support, and resistance levels is 15 October 2025. The reference data in this report has been partly sourced from REFINITIV.
Note 3: Investment decisions should be made depending on an individual's appetite for upside potential, risks, holding duration, and any previous holdings. An 'Exit' from the stock can be considered if the Target Price mentioned as per the Valuation and or the technical levels provided has been achieved and is subject to the factors discussed above.
Note 4: Kalkine reports are prepared based on the stock prices captured either from REFINITIV or Trading View. Typically, REFINITIV or Trading View may reflect stock prices with a delay which could be a lag of 25-30 minutes. There can be no assurance that future results or events will be consistent with the information provided in the report. The information is subject to change without any prior notice.
Technical Indicators Defined: -
Support: A level at which the stock prices tend to find support if they are falling, and a downtrend may take a pause backed by demand or buying interest. Support 1 refers to the nearby support level for the stock and if the price breaches the level, then Support 2 may act as the crucial support level for the stock.
Resistance: A level at which the stock prices tend to find resistance when they are rising, and an uptrend may take a pause due to profit booking or selling interest. Resistance 1 refers to the nearby resistance level for the stock and if the price surpasses the level, then Resistance 2 may act as the crucial resistance level for the stock.
Stop-loss: It is a level to protect further losses in case of unfavourable movement in the stock prices.
Past performance is not a reliable indicator of future performance.

 Please wait processing your request...