
Highlights
- BDI’s Q3 2025 revenue rose 4.1% YoY to CAD 105.3 million.
- Adjusted EBIT climbed 19.8% YoY to CAD 19.4 million in the quarter.
- Q3 profit surged 64.9% YoY to CAD 12.2 million.
- Management anticipates stable conditions into year-end with potential catalysts emerging in 2026 and beyond.
Black Diamond Group Ltd (TSX:BDI) provides modular workforce accommodations and space rental solutions to commercial clients across Canada, the United States, and Australia.
BDI reported third quarter of 2025 (Q3 2025) revenue of CAD 105.3 million, up 4.1% YoY from CAD 101.2 million. Gross profit rose 7.5% YoY to CAD 50.2 million, while adjusted EBIT increased 19.8% YoY to CAD 19.4 million in Q3 2025. Quarterly profit reached CAD 12.2 million, marking a 64.9% YoY jump. Management said the YoY growth was driven by higher MSS rental activity, WFS non-rental and lodge services, improved rental mix and utilization, operating leverage, cost control, and insurance proceeds.
Recent Business Update
Company Outlook
Management’s company outlook indicates expected stability into year-end with catalysts in 2026 and later. MSS rental demand is described as robust with ongoing investment in fleet growth and utilization across core markets. WFS is expected to remain range-bound in the near term with potential expansion in late 2026 as project activity increases. LodgeLink is described as on a growth trajectory supported by product enhancements and acquisitions, and management notes that liquidity and a low leverage profile position the company to pursue organic and inorganic opportunities.
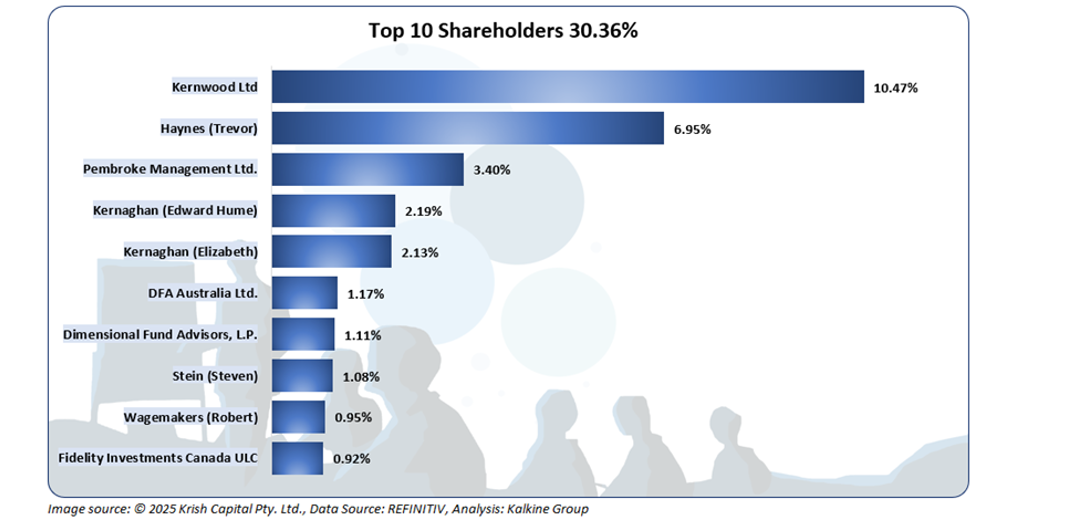
Top Shareholders
The top ten investors collectively account for around 30.36% of the company’s equity, with Kernwood Ltd and Trevor Haynes holding the largest stakes at approximately 10.47% and 6.95%, respectively.
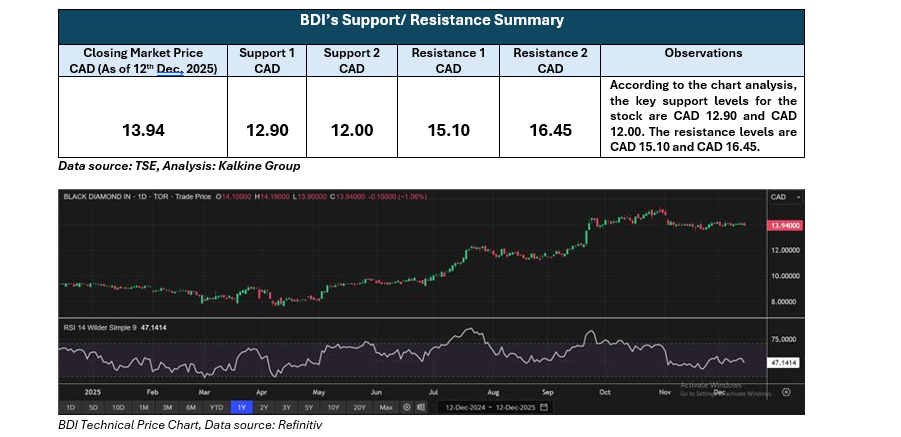
Stock Information
The stock declined by about 0.14% over the past week and gained roughly 20.03% over the last three months. It is currently trading above its 52-week range of CAD 7.60 to CAD 15.38.
Note 1: Past performance is not a reliable indicator of future performance.
Note 2: The reference date for all price data, currency, technical indicators, support, and resistance levels is December 12, 2025. The reference data in this report has been partly sourced from EODHD/Others.
Technical Indicators Defined: -
Support: A level at which the stock prices tend to find support if they are falling, and a downtrend may take a pause backed by demand or buying interest. Support 1 refers to the nearby support level for the stock and if the price breaches the level, then Support 2 may act as the crucial support level for the stock.
Resistance: A level at which the stock prices tend to find resistance when they are rising, and an uptrend may take a pause due to profit booking or selling interest. Resistance 1 refers to the nearby resistance level for the stock and if the price surpasses the level, then Resistance 2 may act as the crucial resistance level for the stock.


 Please wait processing your request...