_09_16_2025_01_23_57_821471.png)
Image source: © 2025 Krish Capital Pty.Ltd
Highlights
- CTC.A’s retail sales rose 3.2% YoY to CAD 5,161.7 million in Q2 2025.
- Net income declined 40.9% YoY to CAD 132.2 million, reflecting one-off impacts.
- Stock gained 1.83% in the past week but is down 4.29% in three months.
Canadian Tire Corporation Ltd. (TSX: CTC.A) operates through three key businesses: Retail, Financial Services and CT REIT. The retail operations are anchored by Canadian Tire, established in 1922, which serves Canadians with products across Living, Playing, Fixing, Automotive, and Seasonal & Gardening categories. The network also includes Party City, PartSource and Gas+.
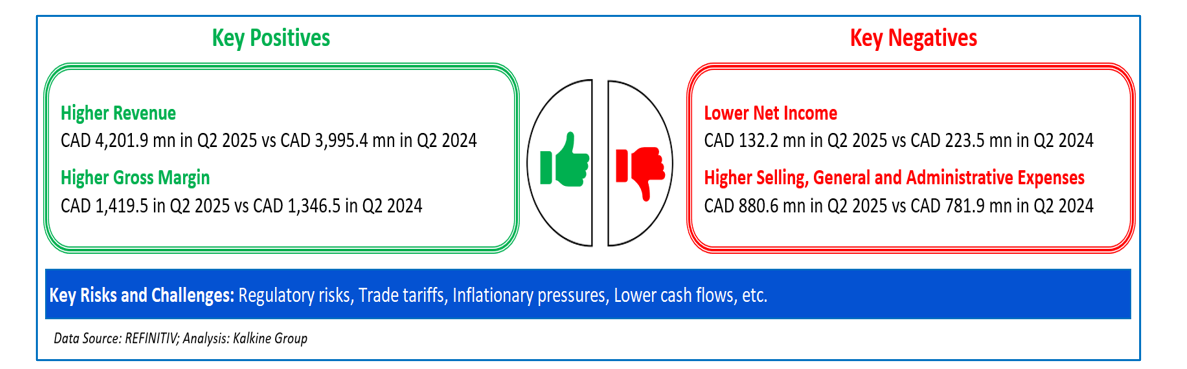
The company’s retail sales were CAD 5,161.7 million in Q2 2025 compared to CAD 5,000.2 million in Q2 2024, an increase of 3.2%, driven by comparable sales growth at Canadian Tire Retail and SportChek. Gross margin was CAD 1,419.5 million in Q2 2025 versus CAD 1,346.5 million in Q2 2024, up 5.4% due to a higher sales mix in seasonal and automotive categories that supported margin expansion.
Net income for the quarter was CAD 132.2 million, compared to CAD 223.5 million in the prior year, a decrease of 40.9%, reflecting the impact of the Helly Hansen sale and transformation-related expenses. Cash generated from operating activities amounted to CAD 821.8 million in Q2 2025 compared to CAD 804.1 million in Q2 2024, an increase of 2.2%, supported by stable operating performance with higher earnings contributions from retail.
Stock Information
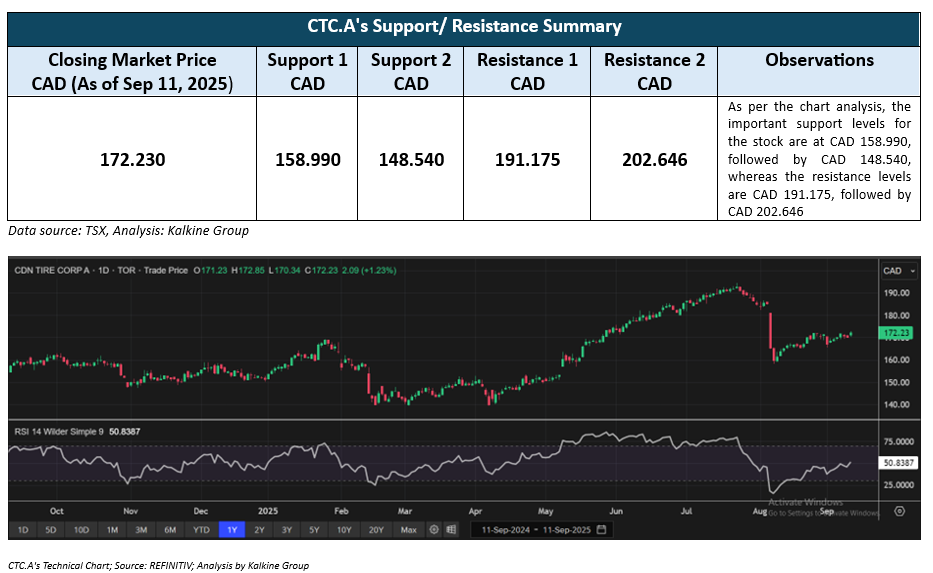
As of the closing price of September 11, 2025, the stock gained about 1.83% over the past week but declined around 4.29% over the last three months. It is currently trading above the 52-week average, which ranges between a high of CAD 194.39 and a low of CAD 139.50.
Note 1: Past performance is not a reliable indicator of future performance.
Note 2: The reference data for all price data, currency, technical indicators, support, and resistance levels Is 11 September 2025. The reference data in this report has been partly sourced from EODHD/Others.
Technical Indicators Defined
Support: A level at which the stock prices tend to find support if they are falling, and a downtrend may take a pause backed by demand or buying interest. Support 1 refers to the nearby support level for the stock and if the price breaches the level, then Support 2 may act as the crucial support level for the stock.
Resistance: A level at which the stock prices tend to find resistance when they are rising, and an uptrend may take a pause due to profit booking or selling interest. Resistance 1 refers to the nearby resistance level for the stock and if the price surpasses the level, then Resistance 2 may act as the crucial resistance level for the stock.


 Please wait processing your request...