_10_11_2023_05_44_18_071761.jpg)
Image source: Shutterstock
Highlights
- As per Doman Building Materials Group, the activity in the market for repairs and remodels has triggered the sales of its products.
- In Q2 2023, the moving rate for expenditures on upgrades and repairs in the United States witnessed a 9.5% year-on-year growth.
Doman Building Materials Group Ltd (TSX: DBM) is a wholesale distributor of building materials and home renovation products required in new constructions and renovations. The company expects that the demand for its goods will remain stable over the long term, thanks to DBM’s strong fundamentals. As per Doman Building Materials Group, the activity in the market for repairs and remodels has triggered the sales of its products.
In Q2 2023, the moving rate for expenditures on upgrades and repairs in the United States witnessed a 9.5% year-on-year growth.
The company has announced to pay a dividend of CAD 0.14 per share later this month. Also, DBM’s stock offers a healthy dividend yield of 7.47% at the last closing price of CAD 7.50 as on October 6, 2023.
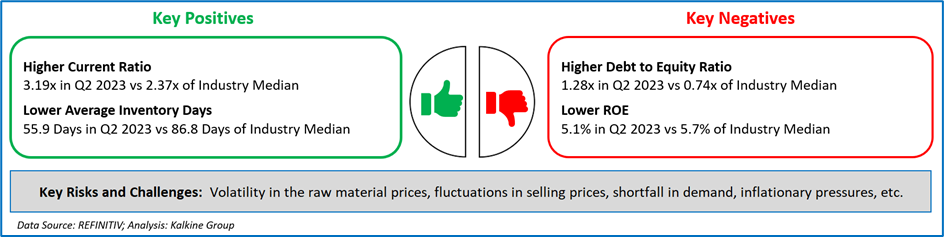
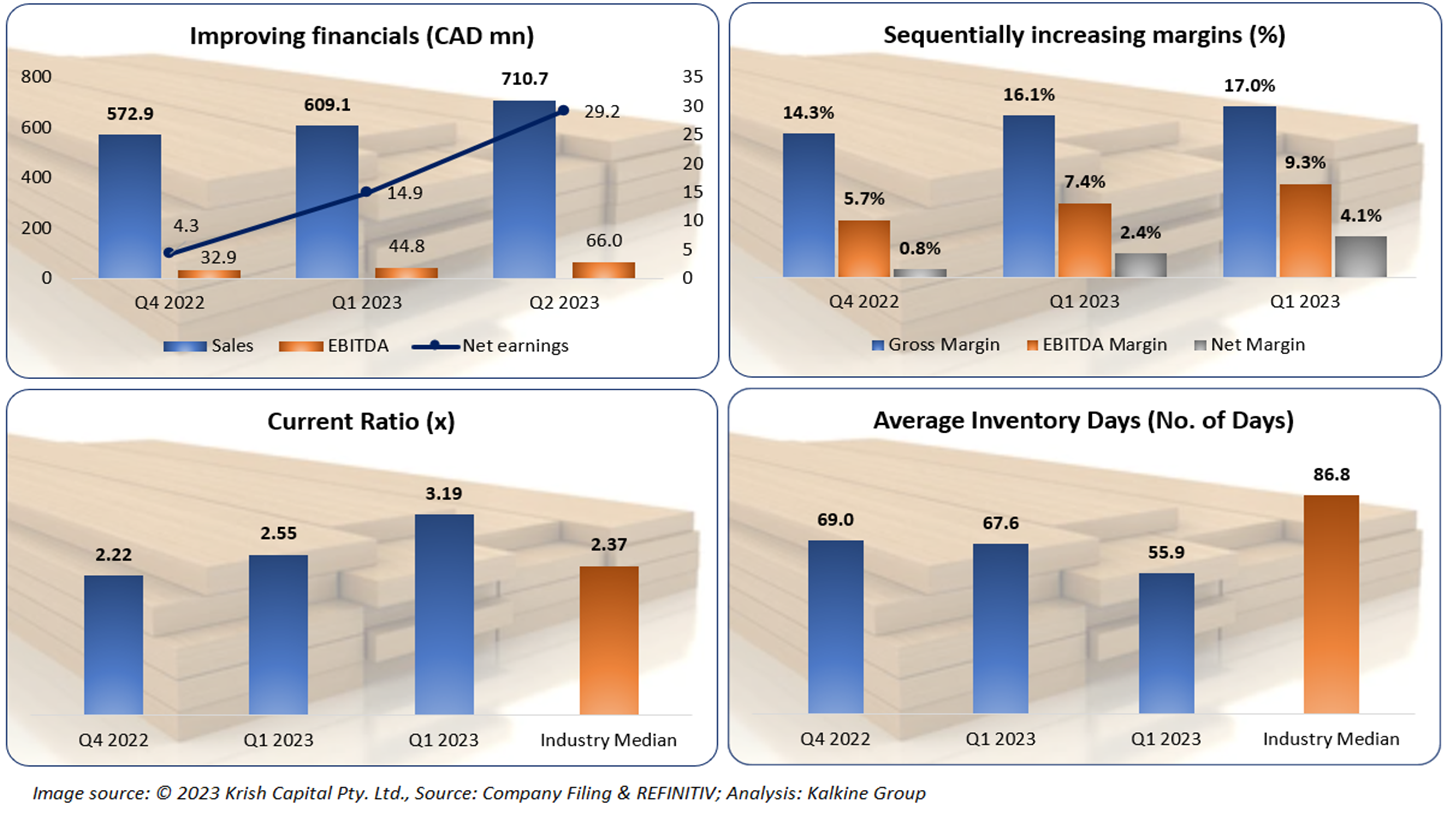
Moreover, DBM delivered higher than the industry median in terms of typical inventory days and achieved sequential growth in both its margin profile as well as current ratio in the reporting period.
For Q2 2023, the group registered a significant increase of 36.4% in its operating earnings to CAD 48.7 million from CAD 35.7 million in Q2 2022. Also, its earnings before income tax grew to CAD 38.2 million, 46.4% higher than CAD 26.1 million reported in Q2 2022. Overall, DBM’s net income stood at CAD 29.1 million, against CAD 20.7 million in the previous corresponding period.
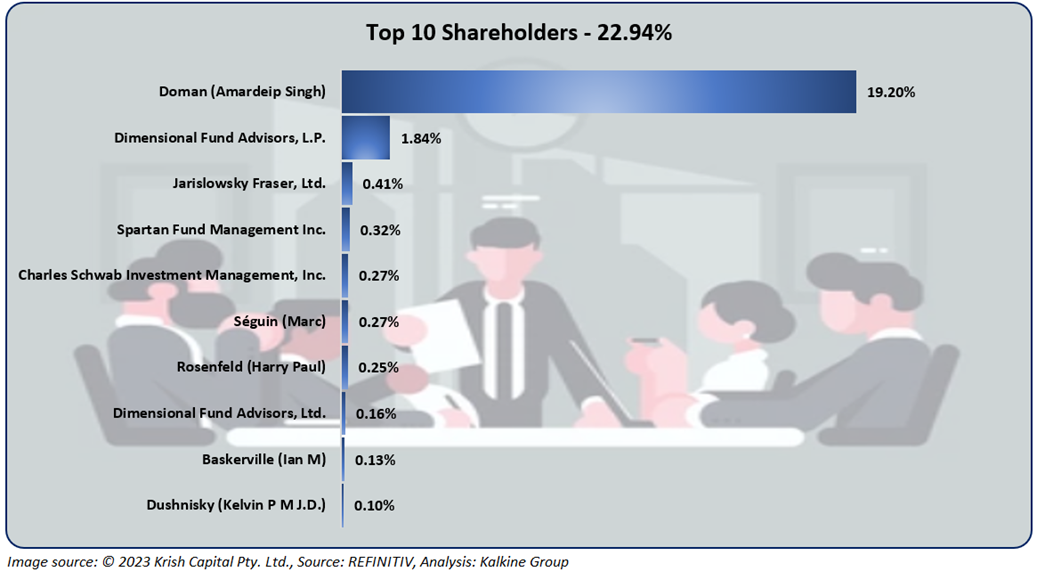
Top 10 Shareholders
Around 22.94% of the total shareholding is held by its top ten shareholders. While Doman (Amardeip Singh) holds the maximum stake in the company at approximately 19.20%, Dimensional Fund Advisors, L.P. owns over 1.84% to be the second highest stakeholder in the company.
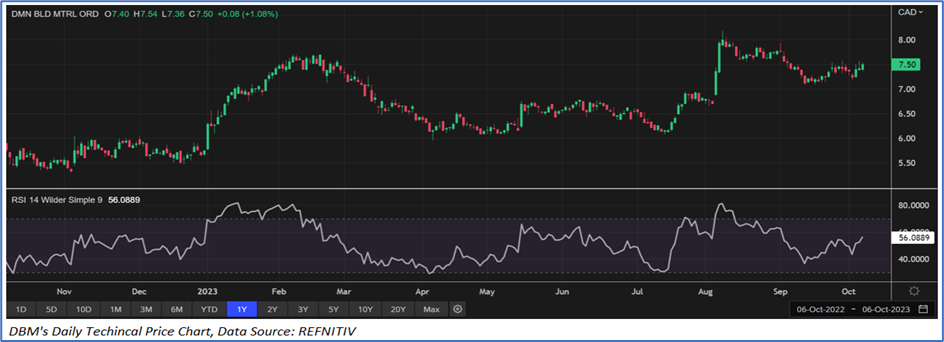
Stock Price Performance
DBM’s stock price has jumped by approximately 1.62% over the last one week. It has decreased by around 0.53% in the last one month. The stock’s 52-week high and low price stand at CAD 8.18 and CAD 5.30, respectively.
Note 1: Past performance is not a reliable indicator of future performance.
Note 2: The reference date for all price data, currency, technical indicators, support, and resistance levels is October 6, 2023. The reference data in this report has been partly sourced from EODHD/Others.


 Please wait processing your request...