_08_08_2025_01_50_25_267600.png)
Image source: © 2025 Krish Capital Pty.Ltd
Highlights
- KNT posted Q1FY25 revenue of USD 144.6 million, up 141.8% YoY on decent output and prices.
- KNT processed 130,337 tonnes of ore, up 36% YoY, with stable output at 8.9 g/t AuEq.
- KNT reaffirmed FY25 guidance of 160k–185k oz AuEq, backed by 82.6k oz in H1 and Stage 3 ramp-up.
K92 Mining Inc. (TSX: KNT) owns and operates the high-grade Kainantu Gold Mine in Papua New Guinea, currently producing approximately 120,000 oz AuEq annually, with plans to exceed 300,000 oz AuEq per year following its Stage 3 Expansion.
In the first quarter of the financial year 2025 (Q1FY25), KNT reported a 141.8% YoY increase in revenue to USD 144.6 million, driven by a sharp jump in gold equivalent production and significantly higher realized gold prices. Earnings from mine operations surged 484.2% YoY to USD 110.5 million, because of better margins due to higher grades, lower operating costs, and increased scale. Earnings from operations grew 1,315.0% YoY to USD 100.6 million, due to better operating leverage as revenues surged while fixed costs remained steady. Earnings from operations rose significantly by 2,190.2% YoY to USD 70.2 million, because of record revenue, lean cost structure, and the no major one-off expenses.
Business Update
The company’s o processed rose 36% YoY and 26% QoQ to 130,337 tonnes in Q1FY25, with increased throughput offsetting lower grades of 8.9 g/t AuEq to sustain strong metal output. K92 mined 133,063 tonnes of ore in Q1FY25, supported by multi-level activity at Kora and Judd, with 2,466 metres of mine development and the second-highest quarterly material movement despite brief commissioning disruptions.
Company Outlook
KNT has reaffirmed its full-year 2025 production guidance of 160,000–185,000 oz AuEq, underpinned by first-half output of 82,633 oz AuEq and stable operational performance in Q2FY25. The company processed 130,337 tonnes of ore at an average grade of 8.9 g/t AuEq, with recoveries of 93.3% for gold and 94.9% for copper and continues to advance the ramp-up of its 1.2 Mtpa Stage 3 Process Plant. Mine development across 13 levels and over 2,466 metres further reinforces KNT’s outlook for delivering on its FY25 targets.
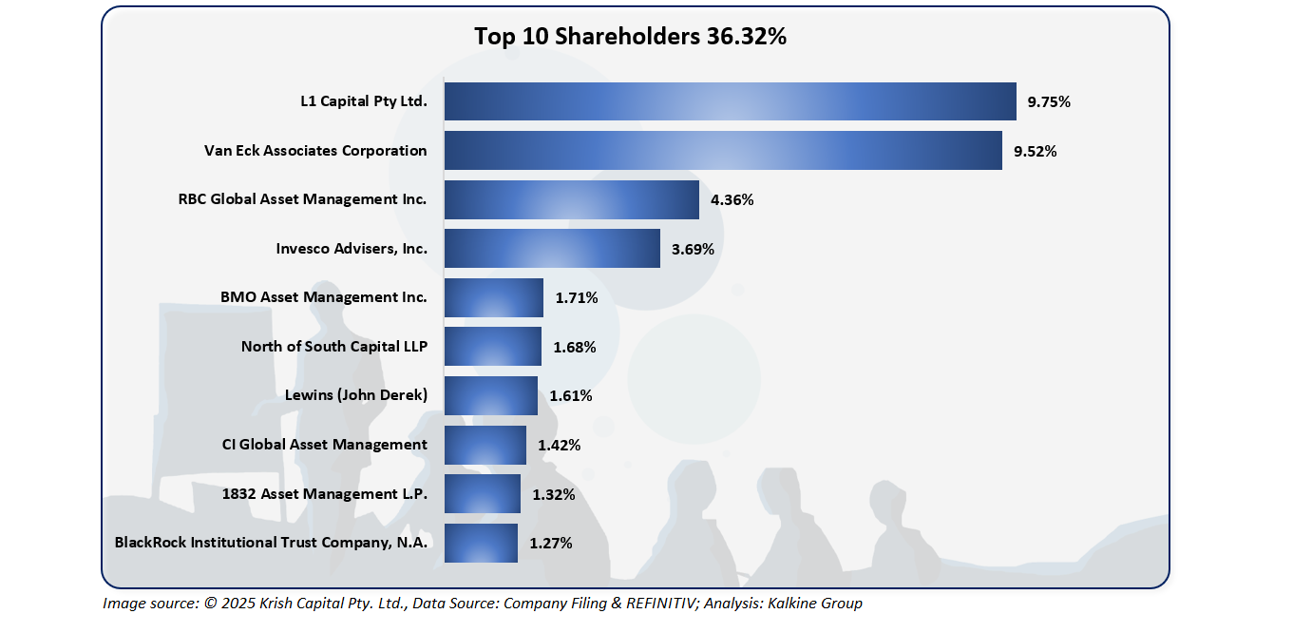
Top 10 shareholders
The top 10 shareholders collectively account for approximately 36.32% of the company’s total shareholding, with L1 Capital Pty Ltd. and Van Eck Associates Corporation holding the largest individual stakes at around 9.75% and 9.52%, respectively.
Stock Information
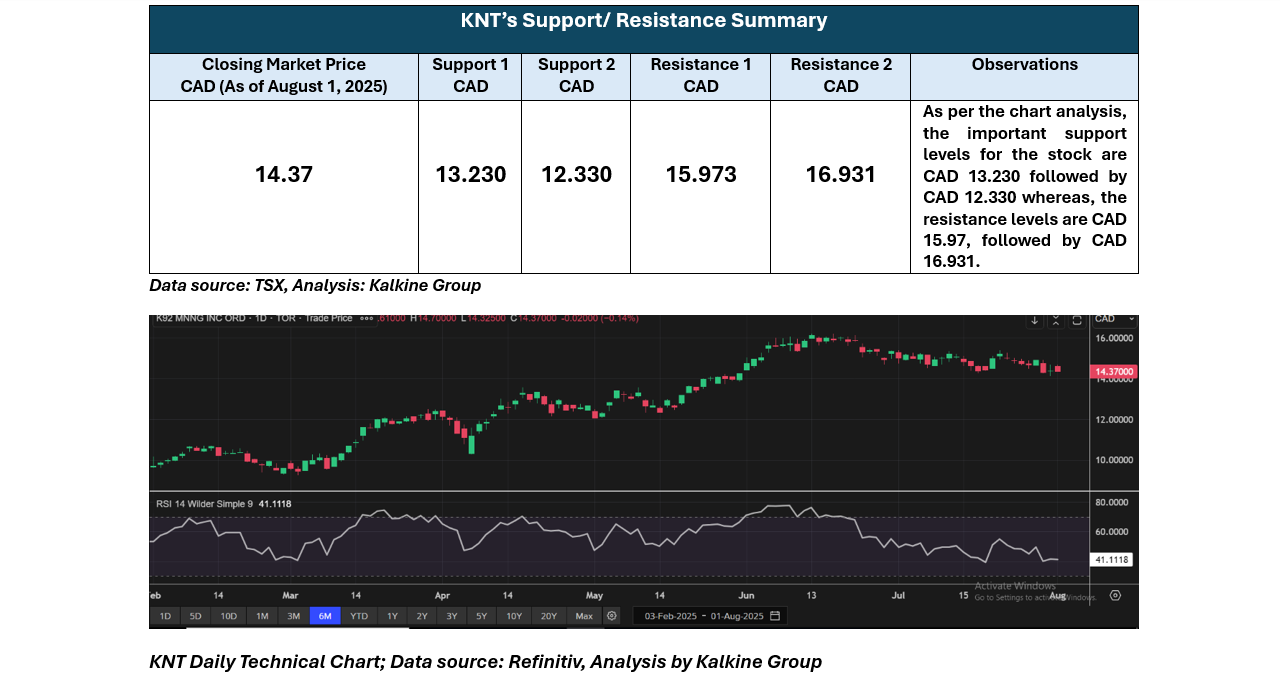
The stock has declined approximately 4.77% over the past month and has increased around 45.59% over the past six months. As of August 1, 2025, it closed at CAD 14.37, trading above the average 52-week low of CAD 6.83 and 52-week high of CAD 16.22.
Note 1: Past performance is not a reliable indicator of future performance.
Note 2: The reference data for all price data, currency, technical indicators, support, and resistance levels Is 1 August 2025. The reference data in this report has been partly sourced from EODHD/Others.
Technical Indicators Defined
Support: A level at which the stock prices tend to find support if they are falling, and a downtrend may take a pause backed by demand or buying interest. Support 1 refers to the nearby support level for the stock and if the price breaches the level, then Support 2 may act as the crucial support level for the stock.
Resistance: A level at which the stock prices tend to find resistance when they are rising, and an uptrend may take a pause due to profit booking or selling interest. Resistance 1 refers to the nearby resistance level for the stock and if the price surpasses the level, then Resistance 2 may act as the crucial resistance level for the stock.


 Please wait processing your request...