_03_03_2025_05_47_07_510484.jpg)
Image source: Shutterstock
Highlights
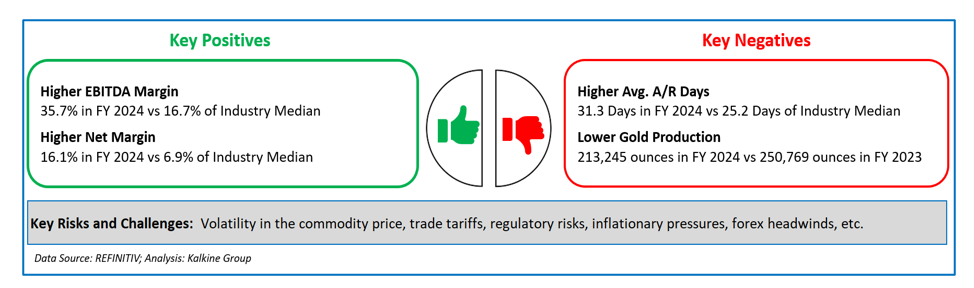
- Mineros’ FY24 revenue increased by 20.4% YoY, reaching USD 538.5 million, driven by higher sales volume and an improved gold price
- EBIT grew by 38.0% YoY to USD 141.5 million in FY24
- Net earnings surged 402.9% YoY, reaching USD 86.5 million, largely due to increased revenue and higher gold prices
- For FY25, Mineros expects gold production between 201,000 to 223,000 ounces, focusing on operational excellence and growth
Mineros S.A. (TSX:MSA) is a Latin American gold mining company with nearly fifty years of operation. It has a diversified asset base, including mines in Colombia, Nicaragua, and Argentina, along with an exploration portfolio across Latin America.
For the fiscal year 2024 (FY24), the company reported a 20.4% YoY revenue increase, reaching USD 538.5 million compared to USD 447.2 million in FY23. This growth was fuelled by higher sales volume and a rise in the average realized gold price. Gross profit also rose by 26.5% YoY to USD 183.9 million, although it was partially offset by a 17% increase in the cost of sales.
Earnings before income taxes (EBIT) grew by 38.0% YoY, reaching USD 141.5 million in FY24 compared to USD 102.5 million in the previous year. Net earnings saw a notable jump of 402.9% YoY, reaching USD 86.5 million, compared to just USD 17.2 million in FY23. This increase was mainly driven by higher revenue, despite the impact of increased taxes.
Recent Business Update
In Q42024, the company increased its capital investments by 8%. It reached USD 27.3 million, up from USD 25.2 million in the prior corresponding period.
Company Outlook
For FY25, the company anticipates gold production to range from 201,000 to 223,000 ounces, driven by the consistent performance of its Nicaragua underground mines and collaborations with artisanal miners. The group continues to prioritize operational excellence and aims to deliver steady, reliable returns.
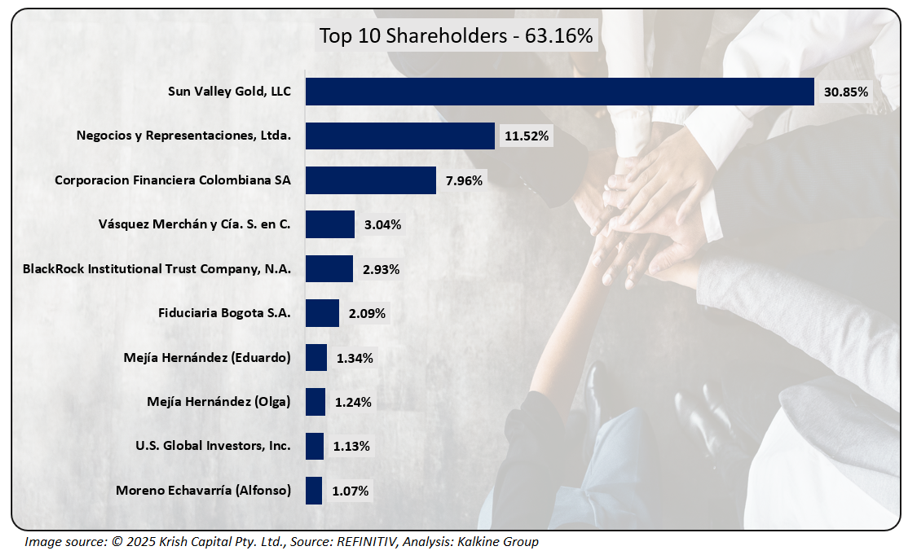
Top 10 Shareholders
The top 10 shareholders of Mineros collectively own approximately 63.16% of the total shares. Sun Valley Gold, LLC holds the largest stake at around 30.85%, followed by Negocios y Representaciones, Ltd. with approximately 11.52%.
Stock Information
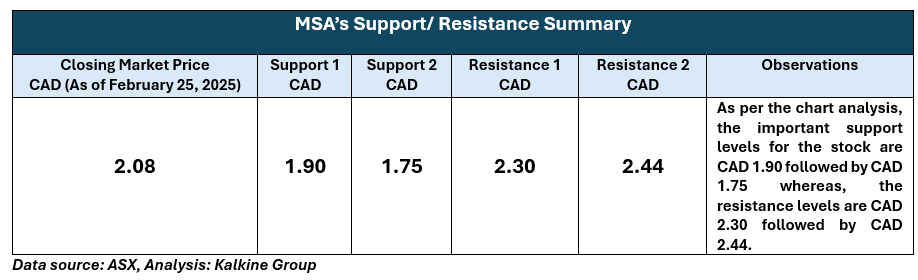
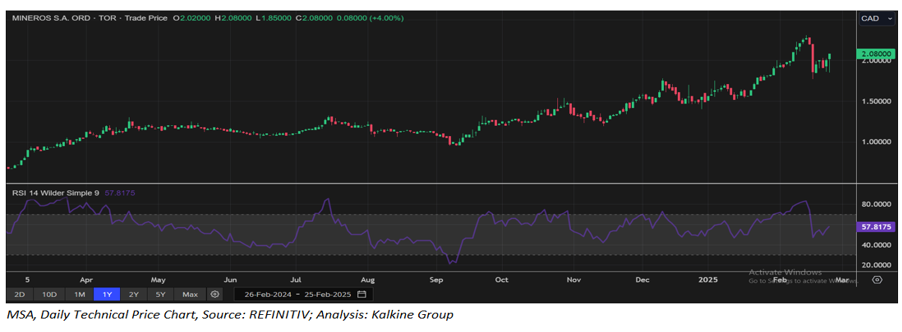
MSA’s stock has experienced a notable increase of approximately 11.82% over the past week and 18.85% over the last month. It is currently trading above the average of its 52-week high of CAD 2.31 and 52-week low of CAD 0.67. As of February 25, 2025, the stock's closing price stands at CAD 2.08.
Note 1: Past performance is not a reliable indicator of future performance.
Note 2: The reference data for all price data, currency, technical indicators, support, and resistance levels is 25 February 2025. The reference data in this report has been partly sourced from EODHD/Others.
Technical Indicators Defined
Support: A level at which the stock prices tend to find support if they are falling, and a downtrend may take a pause backed by demand or buying interest. Support 1 refers to the nearby support level for the stock and if the price breaches the level, then Support 2 may act as the crucial support level for the stock.
Resistance: A level at which the stock prices tend to find resistance when they are rising, and an uptrend may take a pause due to profit booking or selling interest. Resistance 1 refers to the nearby resistance level for the stock and if the price surpasses the level, then Resistance 2 may act as the crucial resistance level for the stock.


 Please wait processing your request...