
Image source: © 2025 Krish Capital Pty.Ltd
Highlights
- Quarterly revenue climbed to CAD 18.3 million from CAD 6.3 million last year, aided by a CAD 13.5 million data license sale.
- EBITDA improved to CAD 15.2 million from CAD 4.4 million in Q2 2024.
- Shareholder free cash flow increased to CAD 11.7 million versus CAD 3.9 million a year earlier.
Pulse Seismic Inc. (TSX: PSD) provides 2D and 3D seismic data to energy companies in Western Canada through acquisition, marketing, and licensing activities.
PSD’s revenue for the second quarter (Q2 2025) was CAD 18.3 million, up 191% from the prior year, primarily due to seismic data license sales, including a CAD 13.5 million transaction, and increased demand from energy sector activity. EBITDA increased to CAD 15.2 million, reflecting the effect of higher sales and a low-cost structure. Net earnings were CAD 9.6 million compared to CAD 1.3 million in Q2 2024, supported by operating leverage and limited capital spending. Shareholder free cash flow rose to CAD 11.7 million from CAD 3.9 million, helped by high cash conversion and data sales.
Business Update
In June 2025, the company noted the importance of its seismic data library, which is the largest licensable library in Canada, with more than 829,000 km of 2D and 65,000 km² of 3D coverage. This asset is used to support exploration and reduce risk for energy companies. Dividend distributions remain a key feature of the company, with a special dividend of CAD 0.20 per share declared in both Q1 and Q2 2025, alongside a 17% increase in the regular quarterly dividend. Total distributions year-to-date amounted to CAD 11.8 million, representing 84% of free cash flow.
Company Outlook
As of June 2025, the company held CAD 25.9 million in cash and had no debt. Revenue visibility remains limited because of the uneven timing of seismic data sales. Industry factors such as merger and acquisition activity, the TMX pipeline expansion, and LNG Canada’s export facility could support future demand, while risks include lower Alberta land sales, commodity price fluctuations, and trade policy uncertainty. The company’s high-margin model, stable financial position, and measured capital allocation are expected to support free cash flow generation and dividend payments.
Top 10 Shareholders
The top 10 shareholders collectively held about 44.90% of outstanding shares, with Ravenswood Management Company and EdgePoint Investment Group Inc. holding approximately 21.88% and 21.43%, respectively.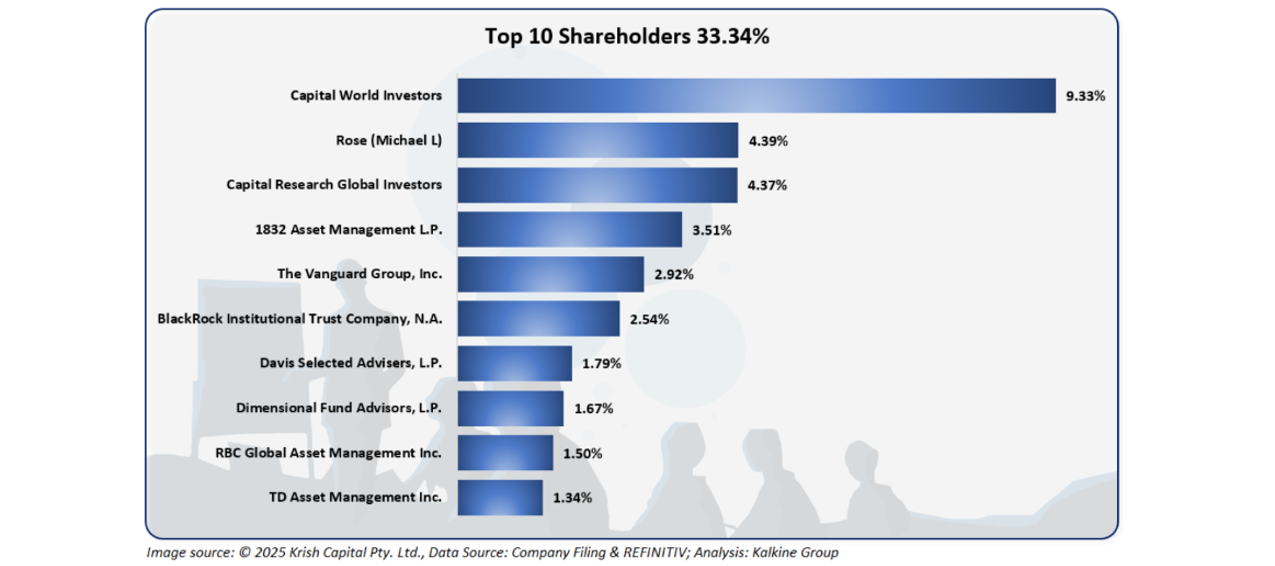
Stock Information
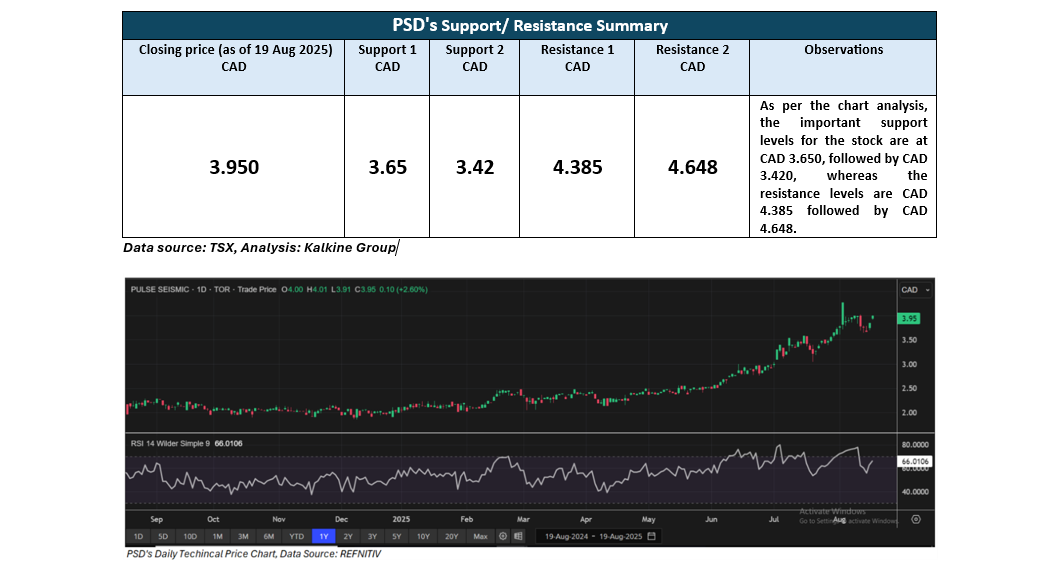
The stock has delivered gains of ~19.53% over the past month and 58.92% over the past three months. It is also trading above its average 52-week high of CAD 4.49 and 52-week low of CAD 2.10, closing at CAD 3.95 on August 19, 2025.
Note 1: Past performance is not a reliable indicator of future performance.
Note 2: The reference data for all price data, currency, technical indicators, support, and resistance levels Is 19 August 2025. The reference data in this report has been partly sourced from EODHD/Others.
Technical Indicators Defined
Support: A level at which the stock prices tend to find support if they are falling, and a downtrend may take a pause backed by demand or buying interest. Support 1 refers to the nearby support level for the stock and if the price breaches the level, then Support 2 may act as the crucial support level for the stock.
Resistance: A level at which the stock prices tend to find resistance when they are rising, and an uptrend may take a pause due to profit booking or selling interest. Resistance 1 refers to the nearby resistance level for the stock and if the price surpasses the level, then Resistance 2 may act as the crucial resistance level for the stock.


 Please wait processing your request...