_08_20_2025_02_37_09_917042.png)
Image source: © 2025 Krish Capital Pty.Ltd
Highlights
- QSR’s Q2 sales grew 15.9% YoY to USD 2,410mn, supported by all segments and higher system-wide sales.
- QSR’s net income declined 34.1% YoY to USD 263mn, impacted by elevated operating expenses.
- QSR declared a Q3 dividend of USD 0.62 per share, payable 7 October 2025.
Restaurant Brands International Inc. (TSX: QSR) is one of the world's largest quick service restaurant companies with over USD45 billion in annual system-wide sales and over 32,000 restaurants in more than 120 countries and territories. QSR operates four of the world’s most recognized quick service restaurant brands, Tim Hortons®, Burger King®, Popeyes®, and Firehouse Subs®.
In the second quarter of 2025 (Q2 2025), QSR reported sales of USD 2,410 million, up 15.9% from USD 2,080 million in Q2 2024, driven by contributions from all business segments and higher system-wide sales. Total operating costs and expenses increased 36% year-over-year to USD 1,927 million, primarily due to higher company restaurant expenses, increased supply chain cost of sales, and other operating costs. As a result, income from operations fell 27.1% yoy to USD 483 million from USD 663 million a year earlier. Net income declined 34.1% to USD 263 million, mainly due to elevated expenses, though partially supported by lower interest costs.
Business Update
On August 7, 2025, the company’s Board of Directors announced a dividend of USD 0.62 per common share for the third quarter of 2025, scheduled to be paid on October 7, 2025, to shareholders and unitholders of record as of September 23, 2025.
Company Outlook
With positive momentum heading into the second half of the year, the company is confident of achieving over 8% organic adjusted operating income growth in 2025. For FY2024, management anticipates free funds flow in the range of CAD 1.2 billion.
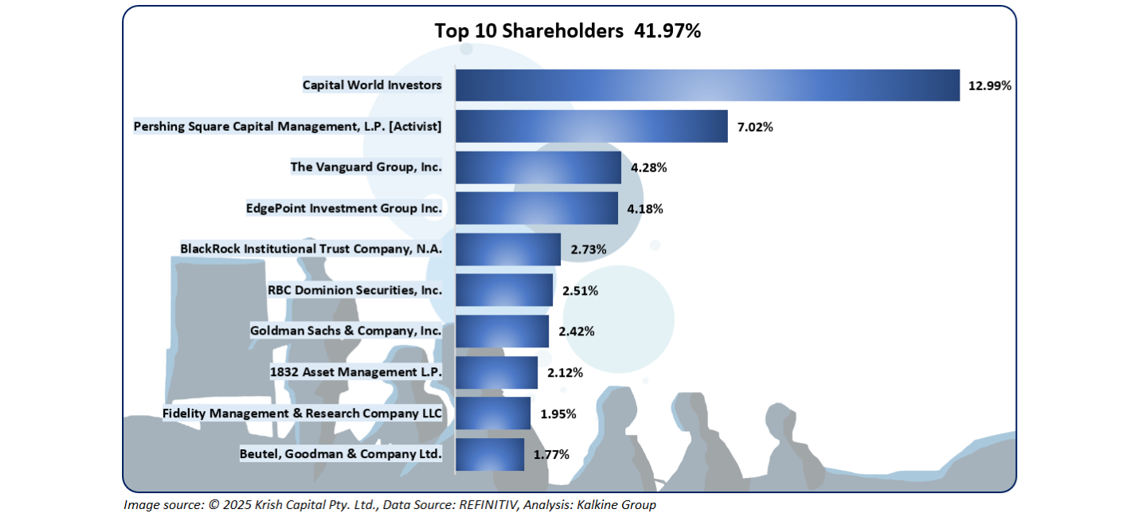
Top 10 Shareholders
The top 10 shareholders collectively account for approximately 41.97% of the company’s total shareholding. Capital World Investors holds the largest stake at about 12.99%, followed by Pershing Square Capital Management, L.P. with around 7.02%.
Stock Information
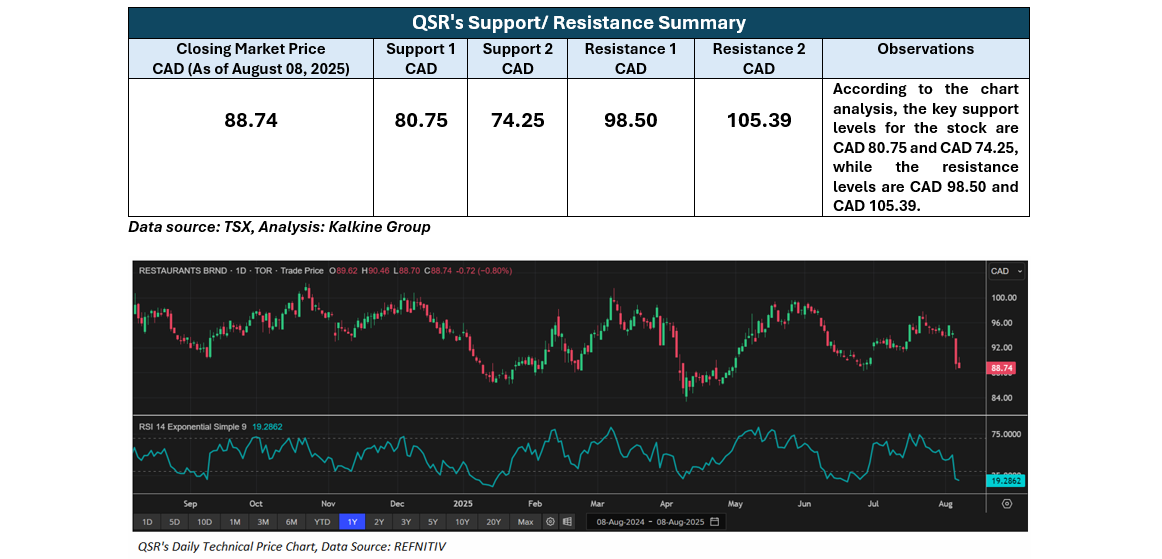
The stock has declined by approximately 5.45% over the past week and 3.54% over the past month. It is currently trading below its 52-week average, which ranges between CAD 83.32 (low) and CAD 102.37 (high), closing at CAD 88.74 on August 08, 2025.
Note 1: Past performance is not a reliable indicator of future performance.
Note 2: The reference data for all price data, currency, technical indicators, support, and resistance levels is August 08 2025. The reference data in this report has been partly sourced from EODHD/Others.
Technical Indicators Defined
Support: A level at which the stock prices tend to find support if they are falling, and a downtrend may take a pause backed by demand or buying interest. Support 1 refers to the nearby support level for the stock and if the price breaches the level, then Support 2 may act as the crucial support level for the stock.
Resistance: A level at which the stock prices tend to find resistance when they are rising, and an uptrend may take a pause due to profit booking or selling interest. Resistance 1 refers to the nearby resistance level for the stock and if the price surpasses the level, then Resistance 2 may act as the crucial resistance level for the stock.


 Please wait processing your request...