
Image source: Shutterstock
Highlights
- Spartan Delta (TSX: SDE) achieved a higher gross margin of 72.2% and a net margin of 16.2% in Q1 2024, outperforming industry medians of 58% and 11.6%, respectively
- In Q1 2024, SDE’s oil and gas revenue decreased by 73.4%, mainly due to decreased volumes and tempering commodity prices
- The company plans to achieve an average daily production between 39,500 and 41,500 BOE/d in FY24
Spartan Delta Corp. (TSX: SDE) is an oil and gas firm. It has built a portfolio of high-quality production and development prospects in the Alberta Deep Basin. It has a market capitalization of CAD 710.12mn.
In the first quarter of 2024, Q1 2024, SDE’s oil and gas sales decreased to CAD 84.1mn against CAD 316.2mn in pcp, marking a decline of 73.4%. It was mainly due to diminished volumes and tempering commodity prices. Earnings before taxes stood lower at CAD 14.9mn against CAD 115.0mn in pcp, partially supported by other income. Overall, the company’s net earnings declined by around 87% in the quarter.
On the brighter side, in Q1 2024, the company had a higher gross margin of 72.2% and a higher net margin of 16.2%, versus the industry average of 58% and 11.6%, respectively.
Recent business update
As per the company’s press release dated May 07, 2024, it completed a strategic acquisition of Willesden Green North in West Shale Basin Duvernay, which advances its stated growth goal.
Company outlook
The company plans to achieve an average daily production between 39,500 and 41,500 barrels of oil equivalent per day (BOE/d) in FY24. Management anticipates generating CAD 176 million in adjusted funds flow and CAD 26 million in free funds flow for the same period.
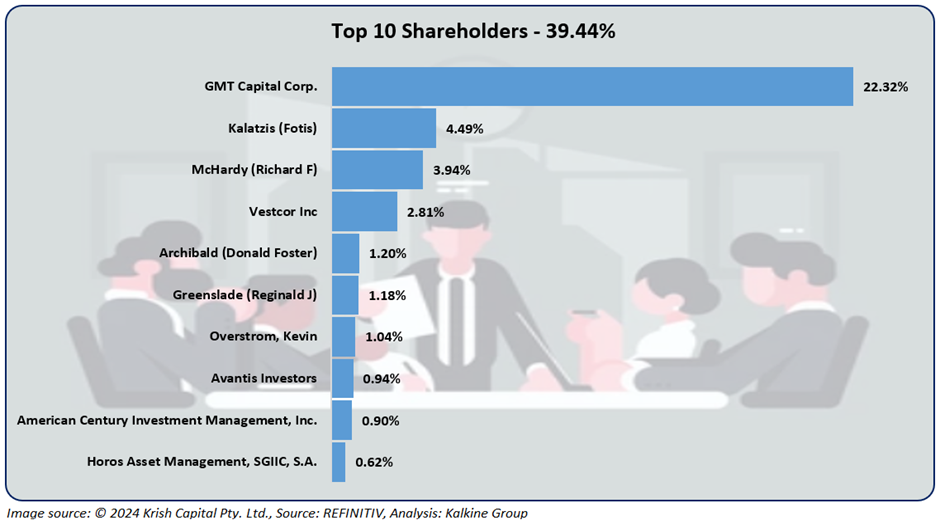
Top 10 Shareholders
Approximately 39.44% of SDE's total shareholding is held by its top 10 shareholders. GMT Capital Corp. holds the largest stake in the company, at approximately 22.32%, followed by Kalatzis (Fotis) with about 4.49%.
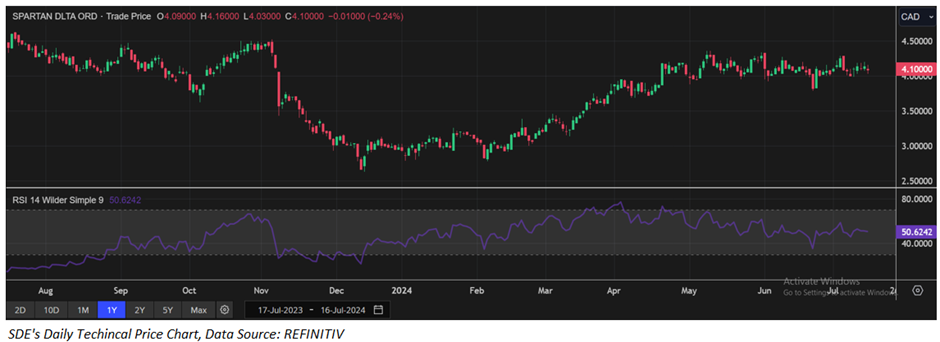
Stock performance
Over the past month, stock price of SDE has increased by approximately 0.24%, and over the last three months, it has risen by about 8.17%. Additionally, the stock is currently trading higher than the average of its 52- week high (CAD 4.63) and low (CAD 2.63).
Note 1: Past performance is not a reliable indicator of future performance.
Note 2: The reference date for all price data, currency, technical indicators, support, and resistance levels is July 16, 2024. The reference data in this report has been partly sourced from EODHD/Others.


 Please wait processing your request...