Section 1: Company Overview and Fundamentals
1.1 Company Overview:
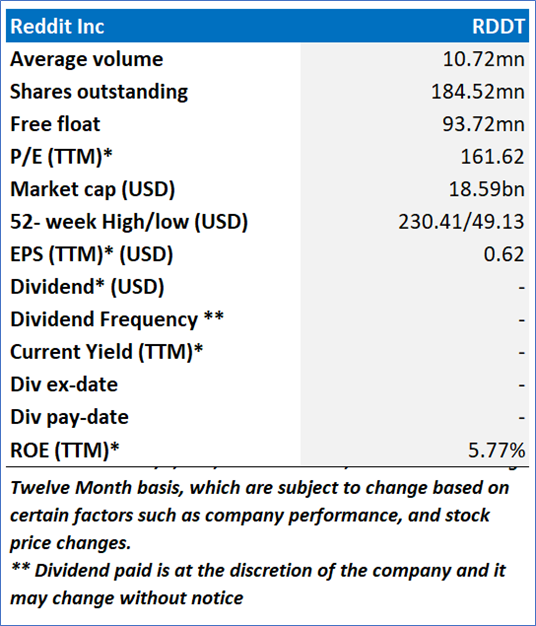
Reddit, Inc. (NYSE: RDDT) operates a social platform, Reddit. Reddit is a community of communities. It is built on shared interests, passion, and trust and is home to open and authentic conversations on the Internet. Reddit is a global, digital city where anyone in the world can join a community to learn from one another, engage in authentic conversations, explore passions, research new hobbies, exchange goods and services, create new communities and experiences, share a few laughs, and find belongings.
Kalkine’s American Tech Report covers the Company Overview, Key positives & negatives, Investment summary, Key investment metrics, Top 10 shareholding, Business updates and insights into company recent financial results, Key Risks & Outlook, Price performance and technical summary, Target Price, and Recommendation on the stock.
Price Performance:
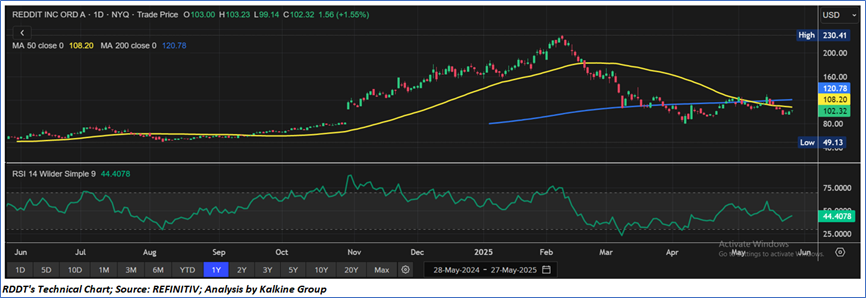
- RDDT's share price has corrected by 35.76% in the past three months. Similarly, a correction of 37.13% over the YTD basis.
- The stock is leaning towards the lower band of its 52-week range of USD 230.41 and 52-week low price of USD 49.13, with the current price near an important support area of USD 90.00- USD 100.00, therefore an expectation of upward movement if the levels sustain.
- The price is currently below both its short-term (50-day) SMA and long-term (200-day) SMA, with the current RSI of 44.41, slightly upward moving, with expectations of upward momentum.
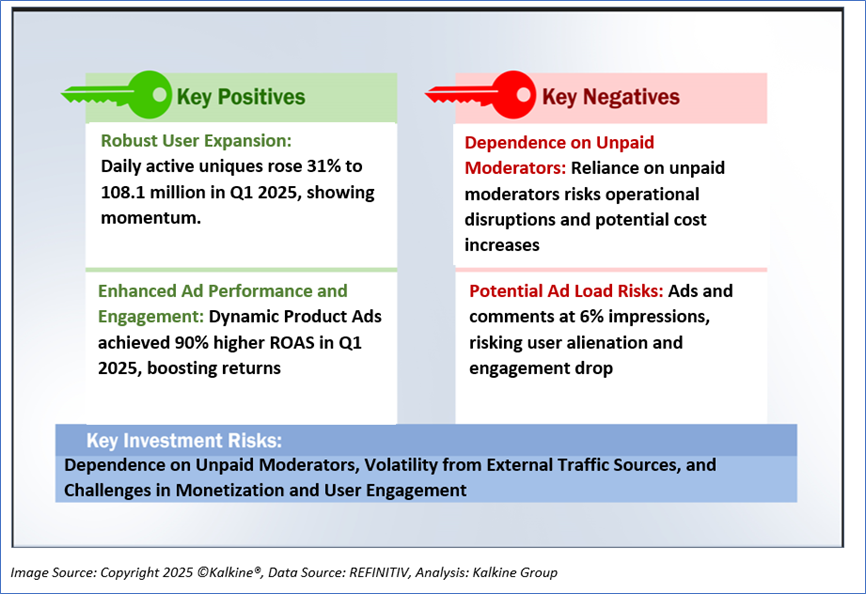
1.2 The Key Positives, Negatives, and Investment summary
1.3 Top 10 shareholders:
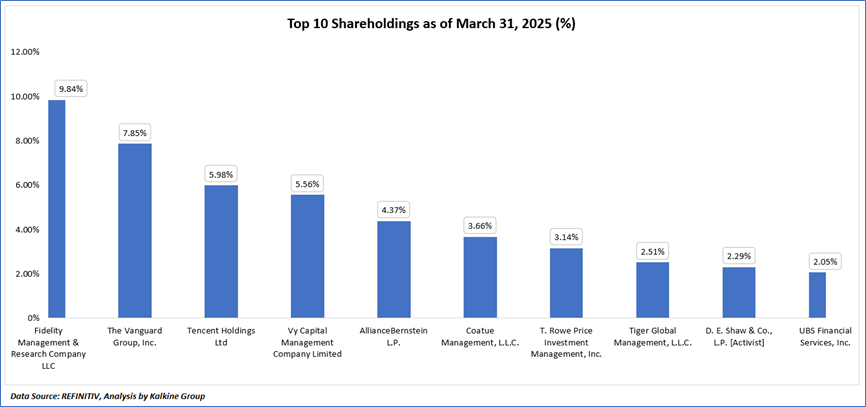
The top 10 shareholders together form ~47.25% of the total shareholding, signifying concentrated shareholding. Fidelity Management & Research Company LLC and The Vanguard Group, Inc. are the biggest shareholders, holding the maximum stake in the company at ~9.84% and ~7.85%, respectively.
Section 2: Business Updates and Financial Highlights
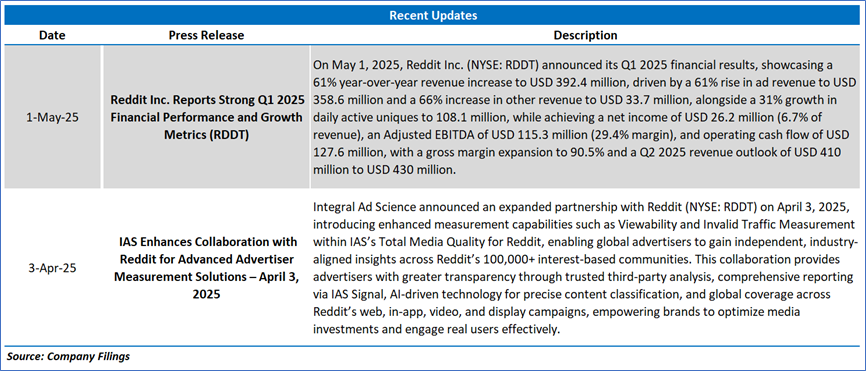
2.1 Recent Updates:
The below picture gives an overview of the recent updates:
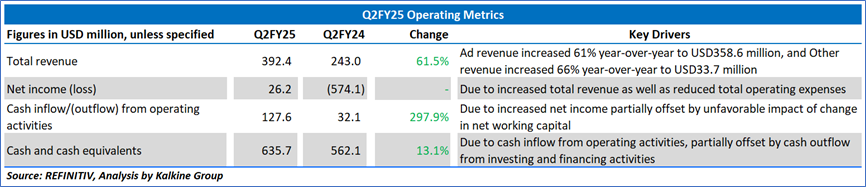
2.2 Insights of Q1FY25:
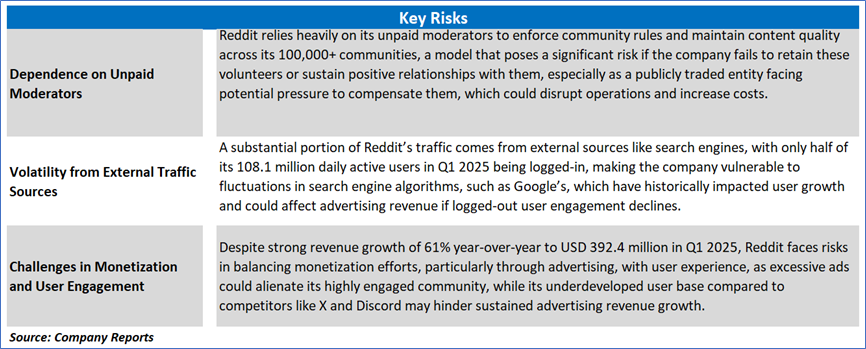
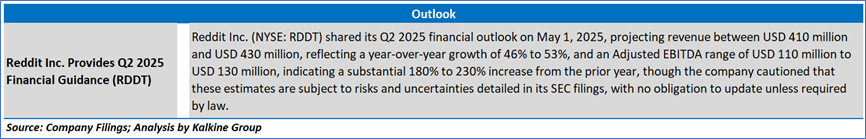
Section 3: Key Risks and Outlook:
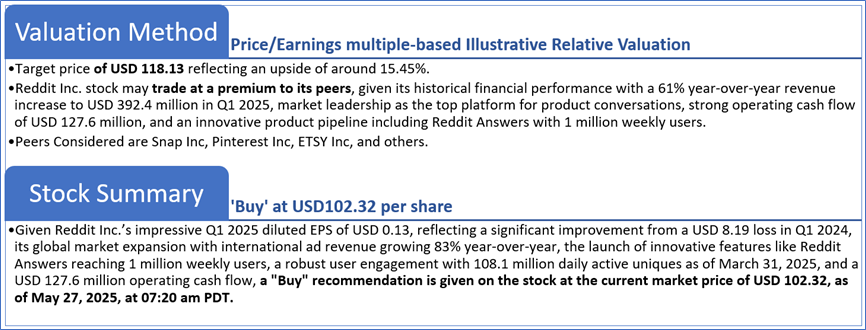
Section 4: Stock Recommendation Summary:
4.1 Technical Summary:
Price Performance:
- RDDT's share price has corrected by 35.76% in the past three months. Similarly, a correction of 37.13% over the YTD basis.
- The stock is leaning towards the lower band of its 52-week range of USD 230.41 and 52-week low price of USD 49.13, with the current price near an important support area of USD 90.00- USD 100.00, therefore an expectation of upward movement if the levels sustain.
- The price is currently below both its short-term (50-day) SMA and long-term (200-day) SMA, with the current RSI of 44.41, slightly upward moving, with expectations of upward momentum.
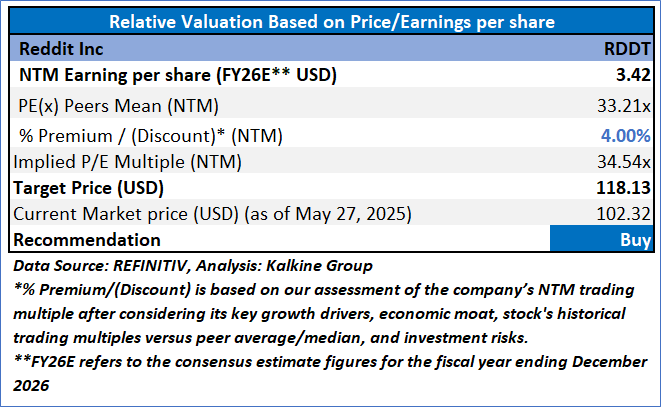
4.2 Fundamental Valuation
Valuation Methodology: Price/Earnings Multiple Based Relative Valuation
Markets are trading in a highly volatile zone currently due to certain macroeconomic issues and geopolitical tensions prevailing. Therefore, it is prudent to follow a cautious approach while investing.
Note 1: Past performance is not a reliable indicator of future performance.
Note 2: The reference date for all price data, currency, technical indicators, support, and resistance levels is May 27, 2025. The reference data in this report has been partly sourced from REFINITIV.
Note 3: Investment decisions should be made depending on an individual's appetite for upside potential, risks, holding duration, and any previous holdings. An 'Exit' from the stock can be considered if the Target Price mentioned as per the Valuation and or the technical levels provided has been achieved and is subject to the factors discussed above.
Note 4: The report publishing date is as per the Pacific Time Zone.
Technical Indicators Defined: -
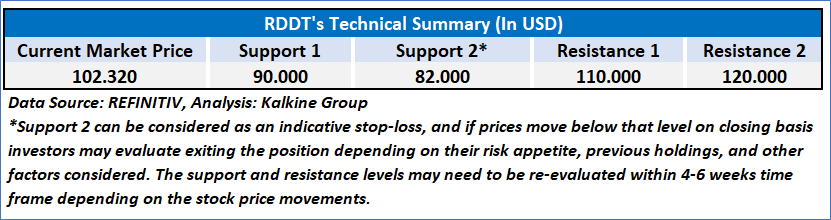
Support: A level at which the stock prices tend to find support if they are falling, and a downtrend may take a pause backed by demand or buying interest. Support 1 refers to the nearby support level for the stock and if the price breaches the level, then Support 2 may act as the crucial support level for the stock.
Resistance: A level at which the stock prices tend to find resistance when they are rising, and an uptrend may take a pause due to profit booking or selling interest. Resistance 1 refers to the nearby resistance level for the stock and if the price surpasses the level, then Resistance 2 may act as the crucial resistance level for the stock.
Stop-loss: It is a level to protect against further losses in case of unfavorable movement in the stock prices.
Past performance is not a reliable indicator of future performance.

 Please wait processing your request...