
Image Source : Krish Capital Pty Ltd
Index Update: Today, the benchmark S&P/TSX Composite Index fell within a few minutes after opening at last week's close and inched up until pre mid-noon. However, unable to carry the momentum, it dipped and travelled in negative territory to finally close at 27,405.42, down by 88.93 (or 0.32%).
Macro Update: US President Donald Trump has announced a framework agreement on tariffs reached between the US and the EU. As per the pact, the EU has been hit by a 15% tariff for all its US exports and has further committed to invest heavily in the US energy sector in the forthcoming months ahead. Canada's benchmark borrowing rates are hovering around 2.5%. The US Fed has kept the lending rates at an average 4.5%. Trump himself had expressed displeasure over this high rate and openly stated he wanted it to be slashed further.
Top Movers: Among the individual stocks, Baytex Energy Corp (4.58%), Cenovus Energy Inc (3.83%), Dye & Durham Ltd (3.86%), EQB Inc (3.89%), and Bitfarms Ltd (3.55%) were the prominent gainers.
Our Stance: The market retains upside potential without being overstretched. The index is now testing a critical support zone near the 27,200 mark. Maintaining this level is vital for preserving near-term bullish momentum. A decisive break below 27,200 could trigger a deeper pullback, with the next major support levels located in the 26,900 to 26,700 range, as observed on the daily chart.
Commodity Update: The euro continued to struggle after the U.S.-EU trade deal largely favoured the U.S., dampening optimism for Europe’s economy. Gold saw a slight rise of 0.023% to $3,374.70, while silver jumped 0.27% to $38.31. Copper dipped 0.04% to $9,792.90. Brent crude gained 0.10% to $70.09, driven by supply concerns after President Trump shortened Russia’s war deadline and positive U.S. trade developments eased EU tariff fears, raising hopes for higher energy demand.
Technical Update:
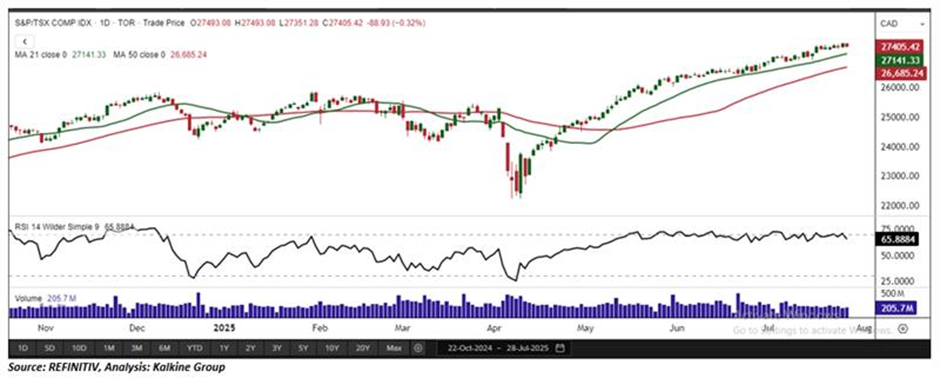
The S&P/TSX Composite Index ended Monday’s session with a modest decline, slipping 88.93 points to close at 27,405.42, down 0.32%. The downturn was primarily driven by weakness in the basic materials sector, which fell 1.44%, weighing on overall market performance. Despite the pullback, the index remains technically well-supported, continuing to trade above its 21-period Simple Moving Average (SMA) a key trend-following indicator that reinforces the prevailing bullish bias. This level has consistently acted as dynamic support throughout the recent uptrend. Momentum also remains constructive. The Relative Strength Index (RSI) currently stands at 65.88, indicating healthy underlying strength while still remaining below the overbought threshold of 70. This suggests that the market retains upside potential without being overstretched. The index is now testing a critical support zone near the 27,200 mark. Maintaining this level is vital for preserving near-term bullish momentum. A decisive break below 27,200 could trigger a deeper pullback, with the next major support levels located in the 26,900 to 26,700 range, as observed on the daily chart.


 Please wait processing your request...