
Image Source : Krish Capital Pty Ltd
Index Update: he benchmark S&P/TSX Composite Index, which tumbled to 25,020.03 in early trades, losing nearly 130 points in the process, climbed to 25,255.92 around mid afternoon, but pared most of its gains and finally ended the day's session with a small gain of 4.23 points or 0.02% at 25,151.26.
Macro Update: The uncertainty lingered as Canada and Mexico stepped up efforts to avoid 25% tariffs on exports to the United States, hoping to persuade President Donald Trump's administration that its improved border security and fentanyl trafficking measures are effective before the March 4 deadline.
Top Movers: Dye & Durham soared 25%. Canada Goose Holdings zoomed 12%. Eldorado Gold, iA Financial Corporation, Lundin Gold, Westshore Terminals Investment Corporation, Cogeco Inc., E-L-Financial Corporation and Metro Inc gained 3 to 5.7%.
Our Stance: The index remains below its 21-period Simple Moving Average (SMA), indicating a continued bearish trend. Currently, the index is testing a key support level at 24,900. Holding above this level is essential to sustaining upward momentum. A breakdown below could trigger a pullback, with additional support zones identified between 24,700 and 24,500 on the weekly chart.
Commodity Update: The dollar strengthened on Tuesday after hitting its lowest level two months earlier, supported by safe-haven flows following U.S. President Donald Trump’s announcement that tariffs on Mexico and Canada would proceed as planned. In commodity markets, gold remained steady at $2,964.80, while silver saw a slight increase of 0.52%, reaching $33.77. Copper fell by 0.02% to $9,487.50. Brent crude oil gained 0.51%, settling at $75.16, driven by fresh U.S. sanctions on Iran, raising concerns over potential supply disruptions. Investors are closely watching upcoming GDP data for further economic direction.
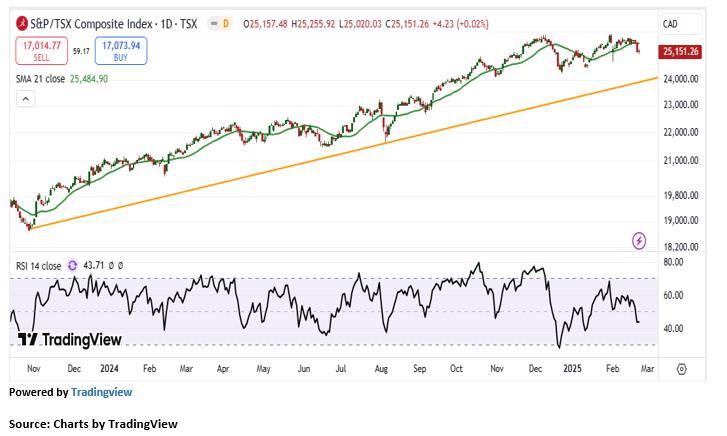
Technical Update: On Monday, the S&P/TSX Composite Index edged higher, closing at 25,151.26, reflecting a modest 0.02% gain. The consumer non-cyclicals sector led the advance, rising by 1.92%, driven by growing optimism in the broader market. From a technical perspective, the index remains below its 21-period Simple Moving Average (SMA), indicating a continued bearish trend. The Relative Strength Index (RSI) stands at 43.71, suggesting the market retains momentum without entering overbought territory, allowing room for further upside. Currently, the index is testing a key support level at 24,900. Holding above this level is essential to sustaining upward momentum. A breakdown below could trigger a pullback, with additional support zones identified between 24,700 and 24,500 on the weekly chart. To maintain a bullish trajectory, the index must stay above these levels and continue capitalizing on market growth opportunities.


 Please wait processing your request...