
Image Source : Krish Capital Pty Ltd
Index Update: The benchmark S&P/TSX Composite Index ended with a loss of 275.15 points or 1.07% at 25,533.10. The index gained 0.25% in the week.
Macro Update:Data from Statistics Canada showed Canadian real gross domestic product decreased 0.2% in November. According to preliminary estimates, the economy rebounded in December and GDP likely grew 0.2%.
Top Movers: Molson Coors Canada (TPX.A.TO) plunged 9%. Finning International (FTT.TO) closed down 6.5%. Propel Holdings (PRL.TO), BRP Inc (DOO.TO), MTY Food Group (MTY.TO), Russel Metals (RUS.TO), Magna International (MG.TO) and Linamar Corporation (LNR.TO) lost 4 to 5.1%.
Our Stance: Traders will be watching the 25,000 level closely, as it represents immediate support. If the index maintains its position above this mark, there could be a potential for a bounce back. However, a break below 23,800 would significantly increase the chances of further declines, with support zones at 23,800 and 23,600 emerging as key levels to watch.
Commodity Update: The U.S. dollar surged Monday, driving the Canadian dollar and Mexican peso to multi-year lows. At the same time, China’s yuan hit a record low in offshore trading after President Trump’s trade war intensification. The dollar’s strength was widespread, with the euro falling to a two-year low and the Swiss franc weakening to its lowest since May. Trump imposed 25% tariffs on Canada and Mexico, and 10% on China, citing illegal immigration and the drug trade as key reasons. In commodity markets, gold fell 0.94% to $2,808.10, silver dropped 1.73% to $31.71, and copper declined 1.28% to $8,932. Brent crude rose 0.80% to $76.29, amid concerns over supply disruptions.
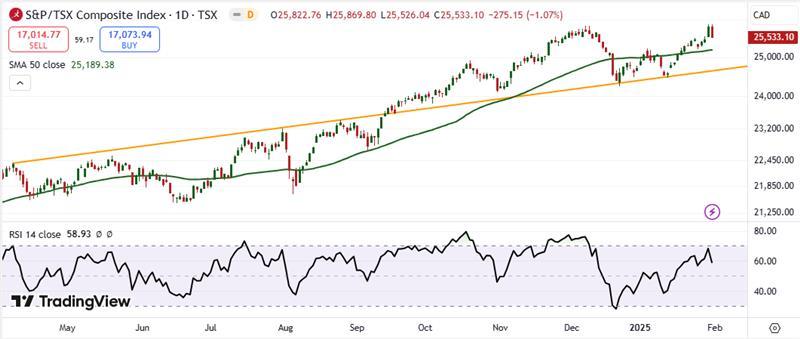
Technical Update: The S&P/TSX Composite Index's 1.07% drop to close at 25,533.10 highlights continued market volatility, driven in part by a notable 2.31% decline in the energy sector. This sharp downturn could dampen investor sentiment in the short term, though the index's position above its 21-period Simple Moving Average (SMA) remains a positive indicator, signaling that the broader short-term trend is still bullish. Traders will be watching the 25,000 level closely, as it represents immediate support. If the index maintains its position above this mark, there could be a potential for a bounce back. However, a break below 23,800 would significantly increase the chances of further declines, with support zones at 23,800 and 23,600 emerging as key levels to watch. The behavior of the index around these levels will be critical in determining whether the current pullback is just a temporary dip or the start of a deeper market correction.


 Please wait processing your request...