Section 1: Company Fundamentals
1.1 Company Overview and Performance summary
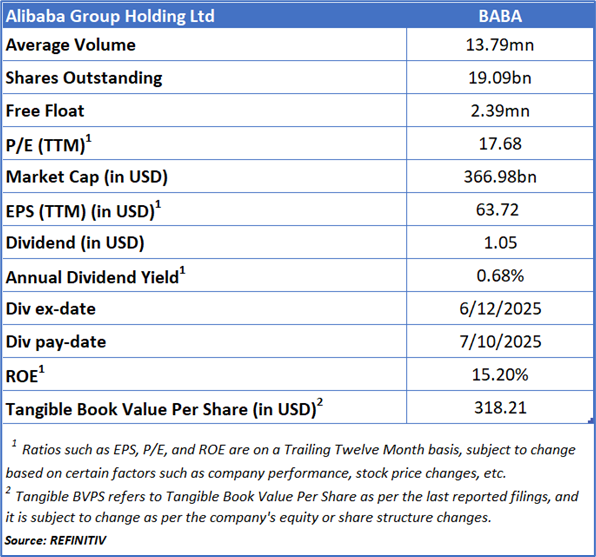
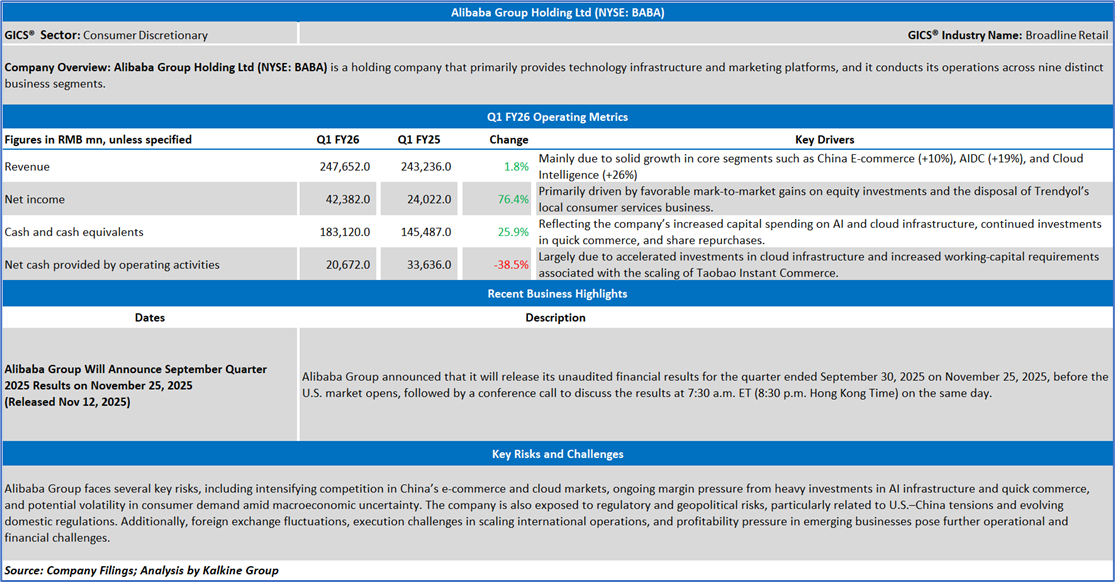
Company Overview:
Alibaba Group Holding Ltd (NYSE: BABA) is a holding company that primarily provides technology infrastructure and marketing platforms, and it conducts its operations across nine distinct business segments.
This US Inflation Report covers the Company Overview & Price performance, Summary table, Key positives & negatives, Key metrics, Company details, technical guidance & Stock recommendation, and Price chart.
Price Performance:
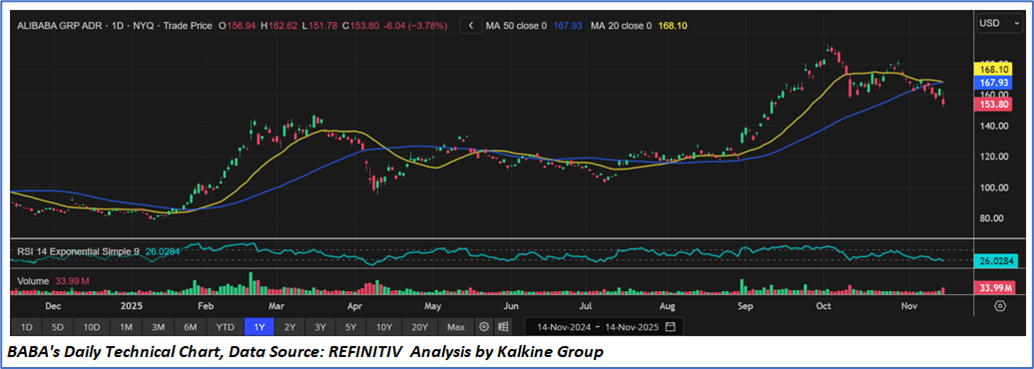
- Alibaba’s price chart shows a notable loss of momentum after a strong uptrend through September and October.
- The stock has broken below the 20-day moving average and is now testing the 50-day moving average, indicating a shift from short-term bullish to corrective sentiment. The recent lower highs and lower lows reinforce this short-term downtrend.
- Volume has picked up on the recent declines, suggesting increased selling pressure.
- RSI has dropped to about 26, placing the stock in oversold territory, which may prompt a short-term bounce, but it also reflects weakening underlying momentum.
1.2 Summary Table
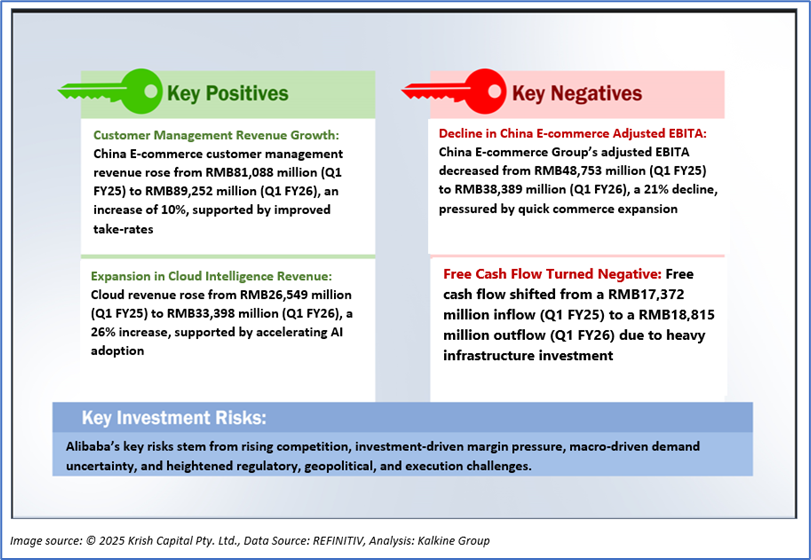
1.3 The Key Positives & Negatives
1.4 Key Metrics
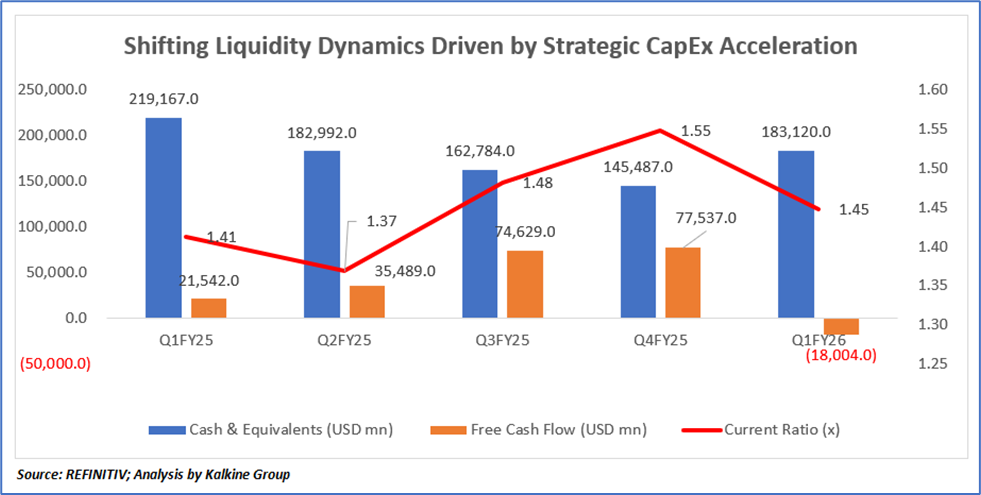
Between Q1 FY25 and Q1 FY26, the company’s financial trajectory reflects a major strategic shift toward long-term capability building, particularly in AI infrastructure, cloud computing capacity, and quick commerce expansion. Cash and equivalents, while still at strong levels, declined relative to Q1 FY25 as Alibaba accelerated capital deployment across these high-priority areas, resulting in significant cash outflows throughout the year. Free cash flow experienced the most visible change, moving from a solid positive position in Q1 FY25 to a negative outflow in Q1 FY26, driven by sharply higher capital expenditures—especially the multi-year RMB380 billion AI investment program—and increased working-capital consumption linked to scaling the Taobao Instant Commerce ecosystem, onboarding new merchants, expanding delivery networks, and supporting user acquisition initiatives. At the same time, the company’s current ratio moderated slightly as short-term operational and investment obligations grew alongside these expansion activities. This reflected not a weakening liquidity profile but rather a reallocation of near-term resources toward strategic growth engines that management believes will unlock stronger revenue and margin potential over the medium to long term. Taken together, the trend shifts between the two quarters highlight Alibaba’s transition into an intensive investment cycle, where cash deployment, infrastructure build-out, and ecosystem expansion temporarily weigh on liquidity metrics but are intended to reinforce competitive positioning in e-commerce, cloud services, and artificial intelligence.
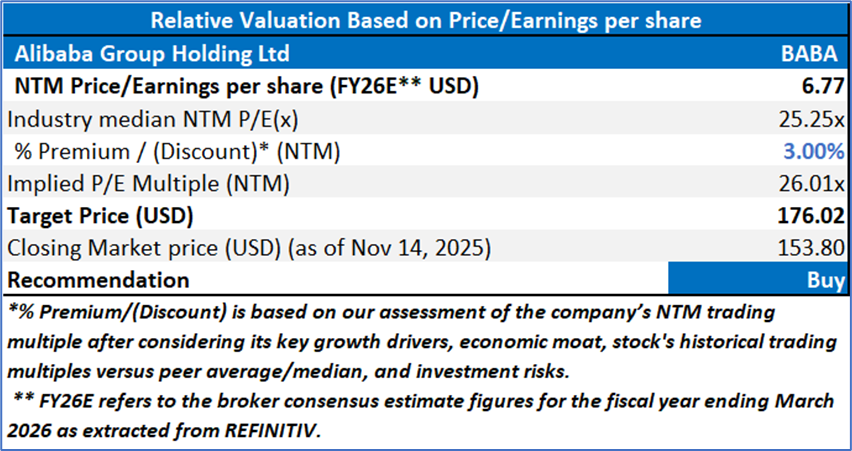
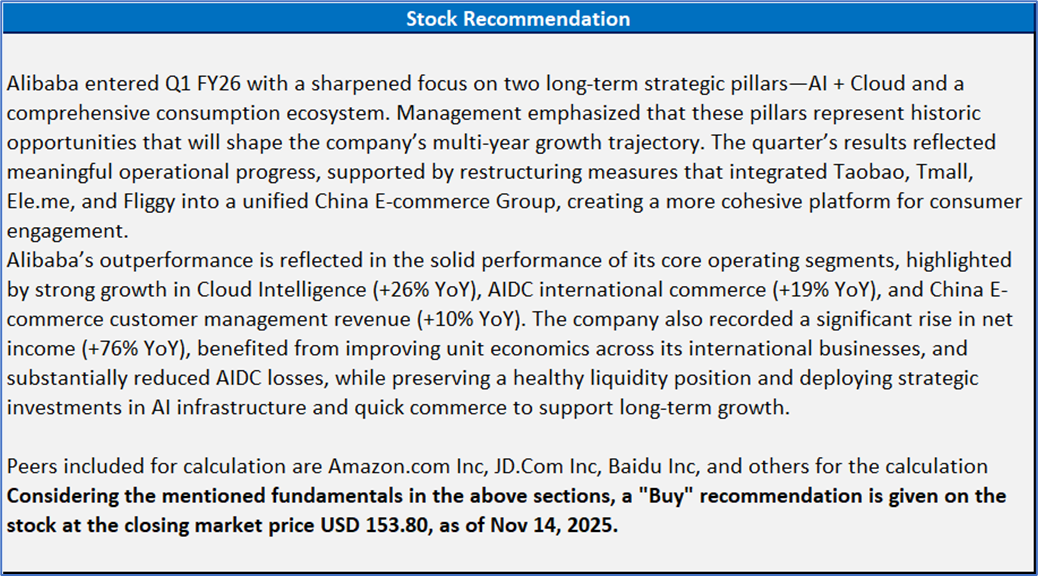
Section 2: Alibaba Group Holding Ltd (NYSE: BABA) (“Buy” at the closing market price of USD 153.80, as of Nov 14,2025)
2.1 Company Details
2.2 Technical Guidance and Stock Recommendation
Markets are trading in a highly volatile zone currently due to certain macroeconomic issues and geopolitical tensions prevailing. Therefore, it is prudent to follow a cautious approach while investing.
Note 1: Past performance is not a reliable indicator of future performance.
Note 2: The reference date for all price data, currency, technical indicators, support, and resistance levels is Oct 23, 2025. The reference data in this report has been partly sourced from REFINITIV.
Note 3: Investment decisions should be made depending on an individual's appetite for upside potential, risks, holding duration, and any previous holdings. An 'Exit' from the stock can be considered if the Target Price mentioned as per the Valuation and or the technical levels provided has been achieved and is subject to the factors discussed above.
Note 4: The report publishing date is as per the Pacific Time Zone.
Technical Indicators Defined: -
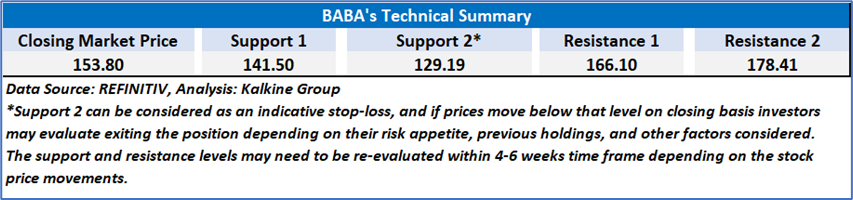
Support: A level at which the stock prices tend to find support if they are falling, and a downtrend may take a pause backed by demand or buying interest. Support 1 refers to the nearby support level for the stock and if the price breaches the level, then Support 2 may act as the crucial support level for the stock.
Resistance: A level at which the stocks prices tend to find resistance when they are rising, and an uptrend may take a pause due to profit booking or selling interest. Resistance 1 refers to the nearby resistance level for the stock and if the price surpasses the level, then Resistance 2 may act as the crucial resistance level for the stock.
Stop-loss: It is a level to protect against further losses in case of unfavorable movement in the stock prices.
Past performance is not a reliable indicator of future performance.
 Please wait processing your request...