Section 1: Company Fundamentals
Company Overview and Performance summary
Company Overview:
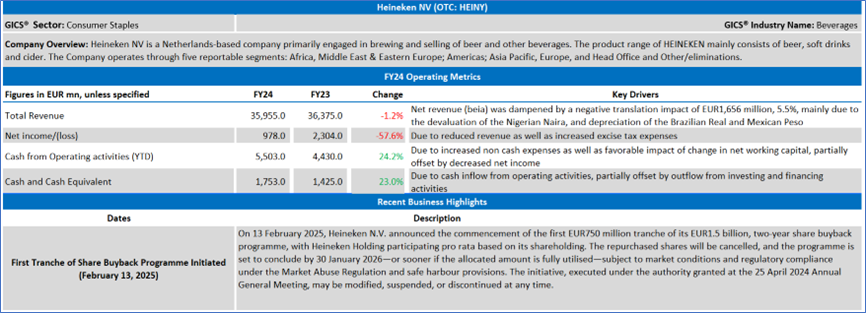
Heineken NV (OTC: HEINY) is a Netherlands-based company primarily engaged in brewing and selling beer and other beverages. The product range of HEINEKEN mainly consists of beer, soft drinks and cider. The Company operates through five reportable segments: Africa, Middle East & Eastern Europe; Americas; Asia Pacific, Europe, and Head Office and Other/eliminations. The Africa, Middle East and Eastern Europe segment includes brands, such as Heineken, Primus, Amstel, Walia and Goldberg.
This US Inflation Report covers the Company Overview & Price performance, Summary table, Key positives & negatives, Key metrics, Company details, technical guidance & Stock recommendation, and Price chart.
Price Performance:
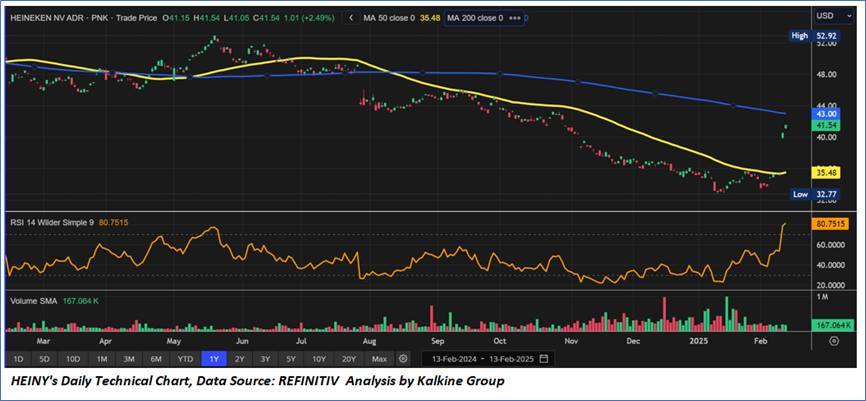
- HEINY's share price has risen by 10.30% in the past three months. On the other hand, in the long term, the stock has fallen by 11.52% over the past year.
- The stock is currently trading near to the lower end of its 52-week range of USD 52.92 and 52-week low price of USD 32.77, with the expectations of an upside movement once the important resistance of USD 44.00-USD 46.00 is broken.
- The price is currently between its short-term (50-day) SMA and long-term (200-day) SMA, with the current RSI of around 80.75.
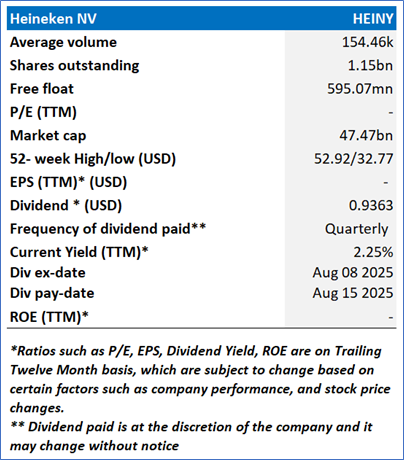
1.2 Summary Table
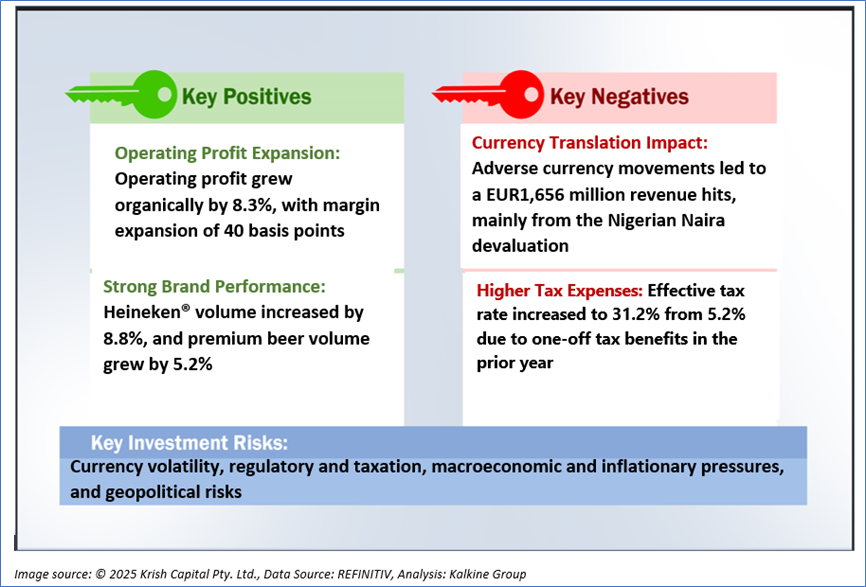
1.3 The Key Positives & Negatives
1.4 Key Metrics
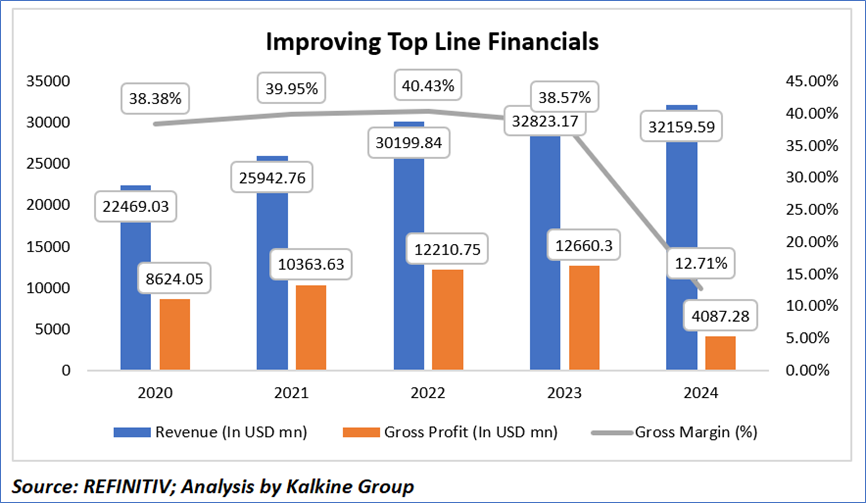
According to HEINY's financial statements, from 2020 to 2024, the company experienced fluctuations in both revenue and gross profit, impacting its gross margin. Revenue increased from USD 22,469.03 million in 2020 to a peak of USD 32,159.50 million in 2024, reflecting a robust growth trajectory likely driven by market expansion, product innovation, or strategic acquisitions. However, the year 2023 saw a slight decrease in revenue to USD 32,823.17 million from USD 30,199.84 million in 2022, which could be attributed to market saturation, competitive pressures, or operational challenges. Gross profit showed a similar trend, peaking at USD 12,210.75 million in 2022 but then sharply declining to USD 408.78 million in 2024, which significantly affected the gross margin, dropping from 40.43% in 2022 to a concerning 12.71% in 2024. This drastic reduction in gross margin suggests increased cost of goods sold, potentially due to rising production costs, supply chain disruptions, or pricing strategy shifts. The increase in gross margin from 2020 to 2022 indicates improved efficiency or favorable pricing, whereas the subsequent decrease highlights challenges in maintaining profitability amidst revenue growth.
Section 2: Heineken NV (OTC: HEINY) (“Buy” at the closing price of 41.54, as of February 13, 2025)
2.1 Company Details
2.2 Technical Guidance and Stock Recommendation
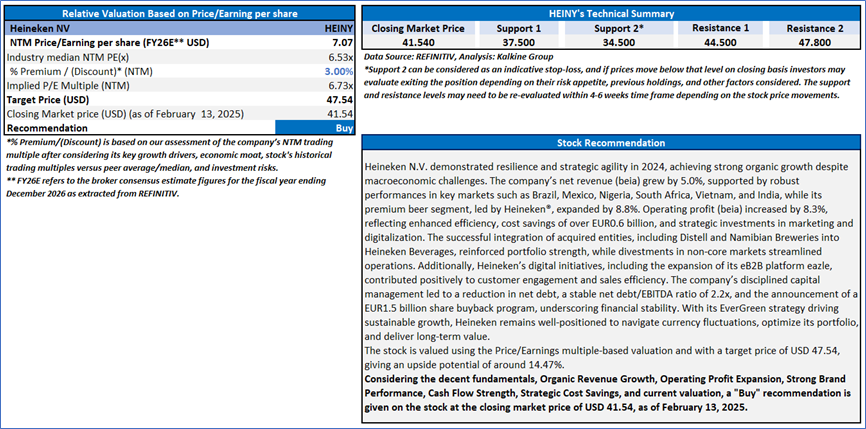
Markets are trading in a highly volatile zone currently due to certain macroeconomic issues and geopolitical tensions prevailing. Therefore, it is prudent to follow a cautious approach while investing.
Note 1: Past performance is not a reliable indicator of future performance.
Note 2: The reference date for all price data, currency, technical indicators, support, and resistance levels is February 13, 2025. The reference data in this report has been partly sourced from REFINITIV.
Note 3: Investment decisions should be made depending on an individual's appetite for upside potential, risks, holding duration, and any previous holdings. An 'Exit' from the stock can be considered if the Target Price mentioned as per the Valuation and or the technical levels provided has been achieved and is subject to the factors discussed above.
Note 4: The report publishing date is as per the Pacific Time Zone.
Technical Indicators Defined: -
Support: A level at which the stock prices tend to find support if they are falling, and a downtrend may take a pause backed by demand or buying interest. Support 1 refers to the nearby support level for the stock and if the price breaches the level, then Support 2 may act as the crucial support level for the stock.
Resistance: A level at which the stocks prices tend to find resistance when they are rising, and an uptrend may take a pause due to profit booking or selling interest. Resistance 1 refers to the nearby resistance level for the stock and if the price surpasses the level, then Resistance 2 may act as the crucial resistance level for the stock.
Stop-loss: It is a level to protect against further losses in case of unfavorable movement in the stock prices.
Past performance is not a reliable indicator of future performance.
 Please wait processing your request...