Section 1: Company Fundamentals
1.1 Company Overview and Performance summary
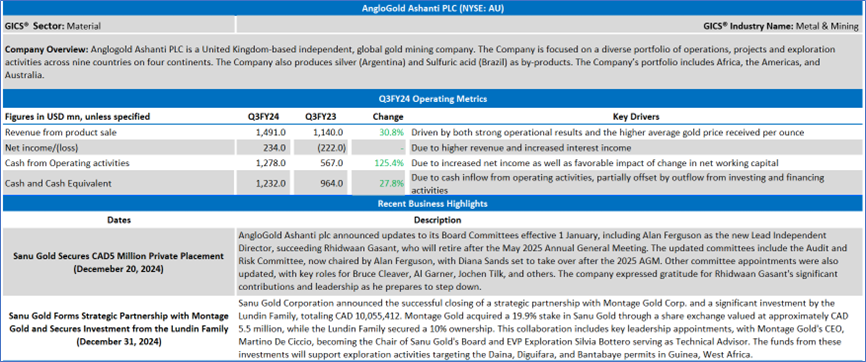
Company Overview:
Anglogold Ashanti PLC (NYSE: AU) is a United Kingdom-based independent, global gold mining company. The Company is focused on a diverse portfolio of operations, projects and exploration activities across nine countries on four continents. The Company also produces silver (Argentina) and Sulfuric acid (Brazil) as by-products. The Company’s portfolio includes Africa, the Americas, and Australia.
This US Inflation Report covers the Company Overview & Price performance, Summary table, Key positives & negatives, Key metrics, Company details, technical guidance & Stock recommendation, and Price chart.
Price Performance:
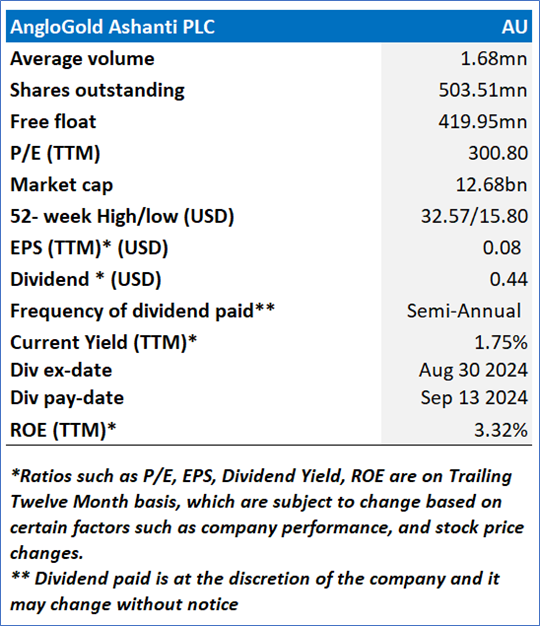
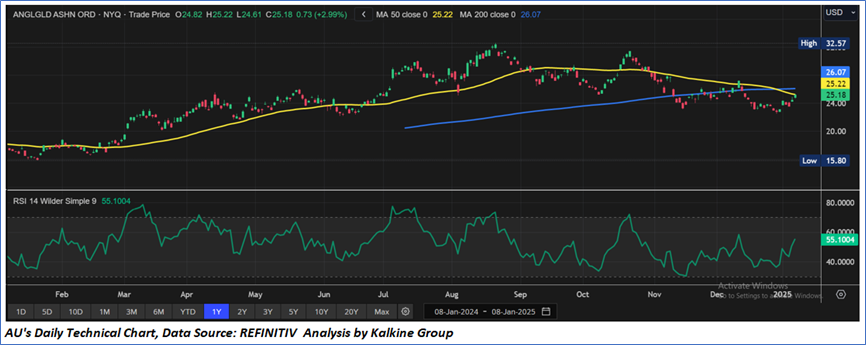
- AU's share price has corrected by 2.59% in the past three months. On the other hand, in the long term, the stock has given a return of 46.56% over the past year.
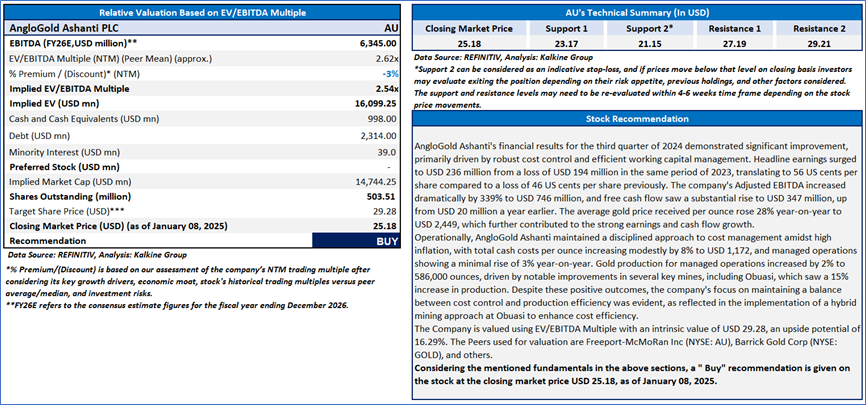
- The stock is currently trading near to the higher end of its 52-week range of USD 32.57 and 52-week low price of USD 15.80, with the expectations of an upside movement in case the USD 23-USD 25 support holds.
- The price is currently below both its short-term (50-day) SMA and long-term (200-day) SMA, with the current RSI of around 55.10.
1.2 Summary Table
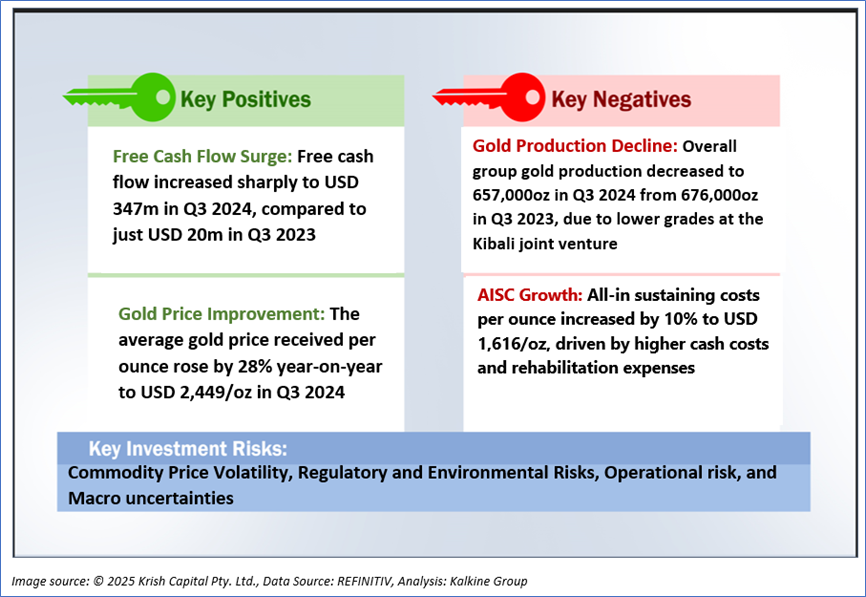
1.3 The Key Positives & Negatives
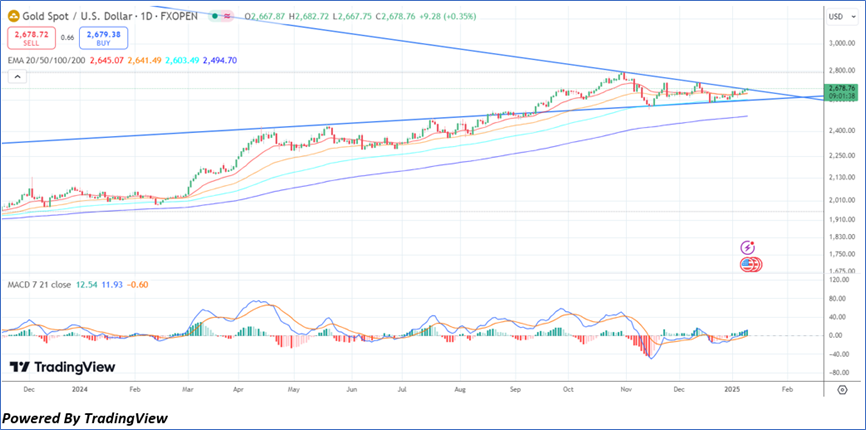
1.4 Underlying Commodity Analysis (Gold)
Gold prices climbed above USD 2,670 per ounce on Friday, marking a fourth consecutive session of gains and positioning for the strongest weekly performance since mid-November. Market participants are keenly awaiting the release of US payroll data, which is expected to influence the Federal Reserve's policy decisions for the year. The December payroll figures are anticipated to reflect continued robust job growth, albeit at a moderated pace. A strong employment report could reduce the likelihood of significant rate cuts by the Federal Reserve, in line with recent FOMC minutes that indicate a potential deceleration in policy easing due to renewed inflation concerns, partly linked to policies expected under Trump's administration. Earlier in the week, the World Gold Council noted the first inflows into physically-backed gold ETFs in four years, driven by heightened demand in Asia, while North American funds recorded their first annual inflow since 2020, and European outflows decreased compared to 2023.
Section 2: AngloGold Ashanti PLC (NYSE: AU) (“Buy” at the closing price of 25.18, as of January 08, 2025)
2.1 Company Details
2.2 Technical Guidance and Stock Recommendation
Markets are trading in a highly volatile zone currently due to certain macroeconomic issues and geopolitical tensions prevailing. Therefore, it is prudent to follow a cautious approach while investing.
Note 1: Past performance is not a reliable indicator of future performance.
Note 2: The reference date for all price data, currency, technical indicators, support, and resistance levels is January 08, 2025. The reference data in this report has been partly sourced from REFINITIV.
Note 3: Investment decisions should be made depending on an individual's appetite for upside potential, risks, holding duration, and any previous holdings. An 'Exit' from the stock can be considered if the Target Price mentioned as per the Valuation and or the technical levels provided has been achieved and is subject to the factors discussed above.
Note 4: The report publishing date is as per the Pacific Time Zone.
Technical Indicators Defined: -
Support: A level at which the stock prices tend to find support if they are falling, and a downtrend may take a pause backed by demand or buying interest. Support 1 refers to the nearby support level for the stock and if the price breaches the level, then Support 2 may act as the crucial support level for the stock.
Resistance: A level at which the stocks prices tend to find resistance when they are rising, and an uptrend may take a pause due to profit booking or selling interest. Resistance 1 refers to the nearby resistance level for the stock and if the price surpasses the level, then Resistance 2 may act as the crucial resistance level for the stock.
Stop-loss: It is a level to protect against further losses in case of unfavorable movement in the stock prices.
Past performance is not a reliable indicator of future performance.
 Please wait processing your request...