Section 1: Company Fundamentals
1.1 Company Overview and Performance summary
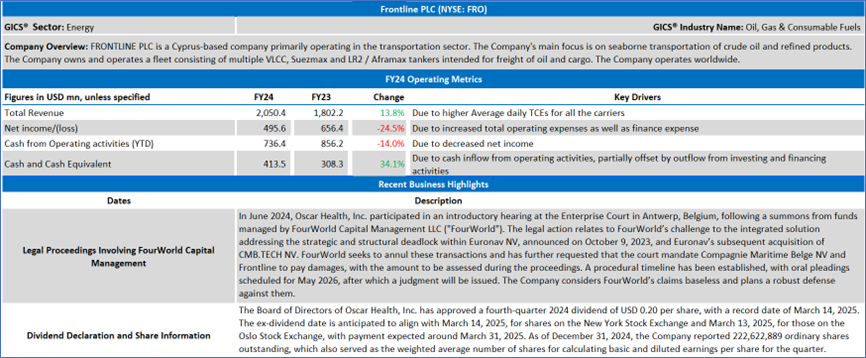
Company Overview:
FRONTLINE PLC (NYSE: FRO) is a Cyprus-based company primarily operating in the transportation sector. The Company's main focus is on seaborne transportation of crude oil and refined products. The Company owns and operates a fleet consisting of multiple VLCC, Suezmax and LR2 / Aframax tankers intended for freight of oil and cargo. The Company operates worldwide.
This US Inflation Report covers the Company Overview & Price performance, Summary table, Key positives & negatives, Key metrics, Company details, technical guidance & Stock recommendation, and Price chart.
Price Performance:
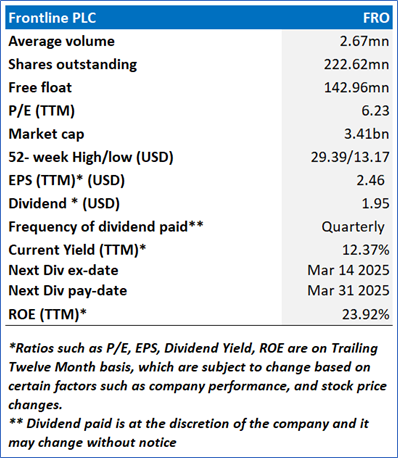
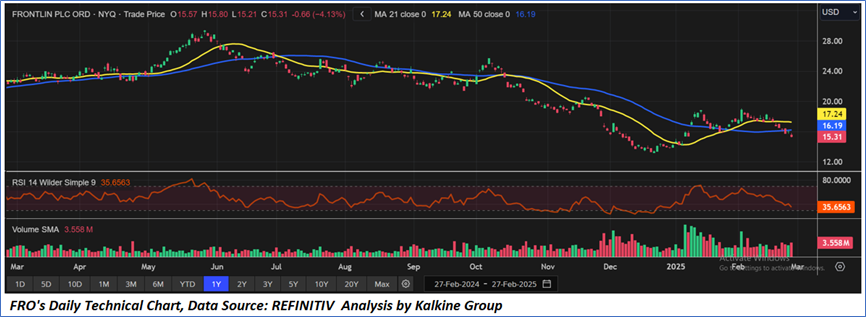
- FRO's share price has corrected by 8.76% in the past three months. Similarly, in the long term, the stock has fallen by 32.67% over the past year.
- The stock is currently trading near to the lower end of its 52-week range of USD 29.39 and 52-week low price of USD 13.17, with the expectations of an upside movement once the important support levels of USD 14.00-USD 15.00 hold.
- The price is currently below its short-term (50-day) SMA and long-term (200-day) SMA, with the current RSI of around 35.66.
1.2 Summary Table
1.3 The Key Positives & Negatives
1.4 Key Metrics
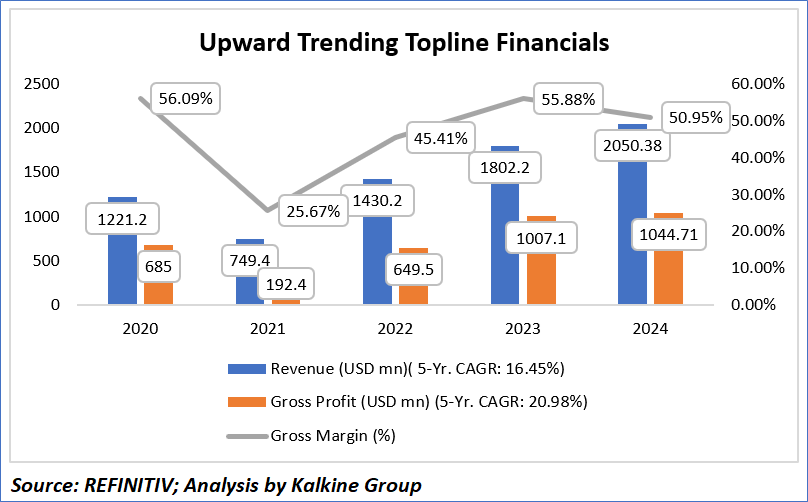
FRO's revenue exhibited a 5-year CAGR of 16.45%, rising from USD 1,221.2 million in 2020 to USD 2,050.38 million in 2024, indicating consistent business growth despite a dip in 2021. The gross profit increased at a higher 5-year CAGR of 20.98%, reaching USD 1,044.71 million in 2024, reflecting improved operational efficiency. The gross margin displayed a fluctuating trend, declining sharply to 25.67% in 2021 before rebounding to 50.95% in 2024, underscoring the company's ability to recover its profitability levels. The robust margin recovery in recent years highlights effective cost management and increased pricing power, contributing to overall financial performance.
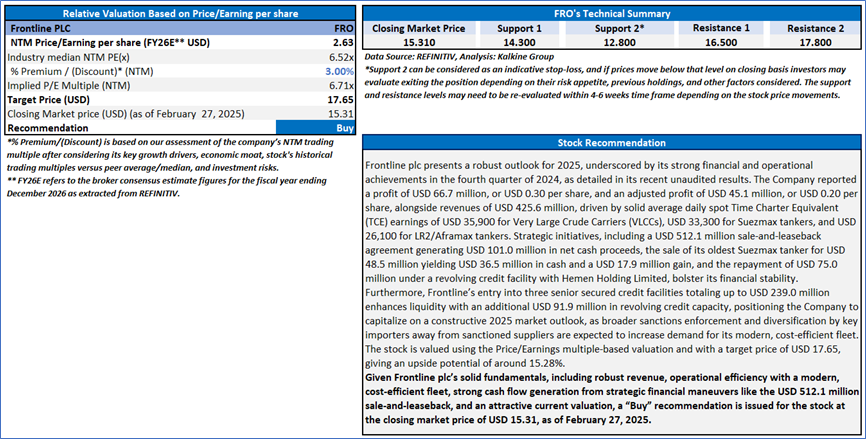
Section 2: Frontline PLC (NYSE: FRO) (“Buy” at the closing price of 15.31, as of February 27, 2025)
2.1 Company Details
2.2 Technical Guidance and Stock Recommendation
Markets are trading in a highly volatile zone currently due to certain macroeconomic issues and geopolitical tensions prevailing. Therefore, it is prudent to follow a cautious approach while investing.
Note 1: Past performance is not a reliable indicator of future performance.
Note 2: The reference date for all price data, currency, technical indicators, support, and resistance levels is February 27, 2025. The reference data in this report has been partly sourced from REFINITIV.
Note 3: Investment decisions should be made depending on an individual's appetite for upside potential, risks, holding duration, and any previous holdings. An 'Exit' from the stock can be considered if the Target Price mentioned as per the Valuation and or the technical levels provided has been achieved and is subject to the factors discussed above.
Note 4: The report publishing date is as per the Pacific Time Zone.
Technical Indicators Defined: -
Support: A level at which the stock prices tend to find support if they are falling, and a downtrend may take a pause backed by demand or buying interest. Support 1 refers to the nearby support level for the stock and if the price breaches the level, then Support 2 may act as the crucial support level for the stock.
Resistance: A level at which the stocks prices tend to find resistance when they are rising, and an uptrend may take a pause due to profit booking or selling interest. Resistance 1 refers to the nearby resistance level for the stock and if the price surpasses the level, then Resistance 2 may act as the crucial resistance level for the stock.
Stop-loss: It is a level to protect against further losses in case of unfavorable movement in the stock prices.
Past performance is not a reliable indicator of future performance.
 Please wait processing your request...