Section 1: Company Fundamentals
1.1 Company Overview and Performance summary
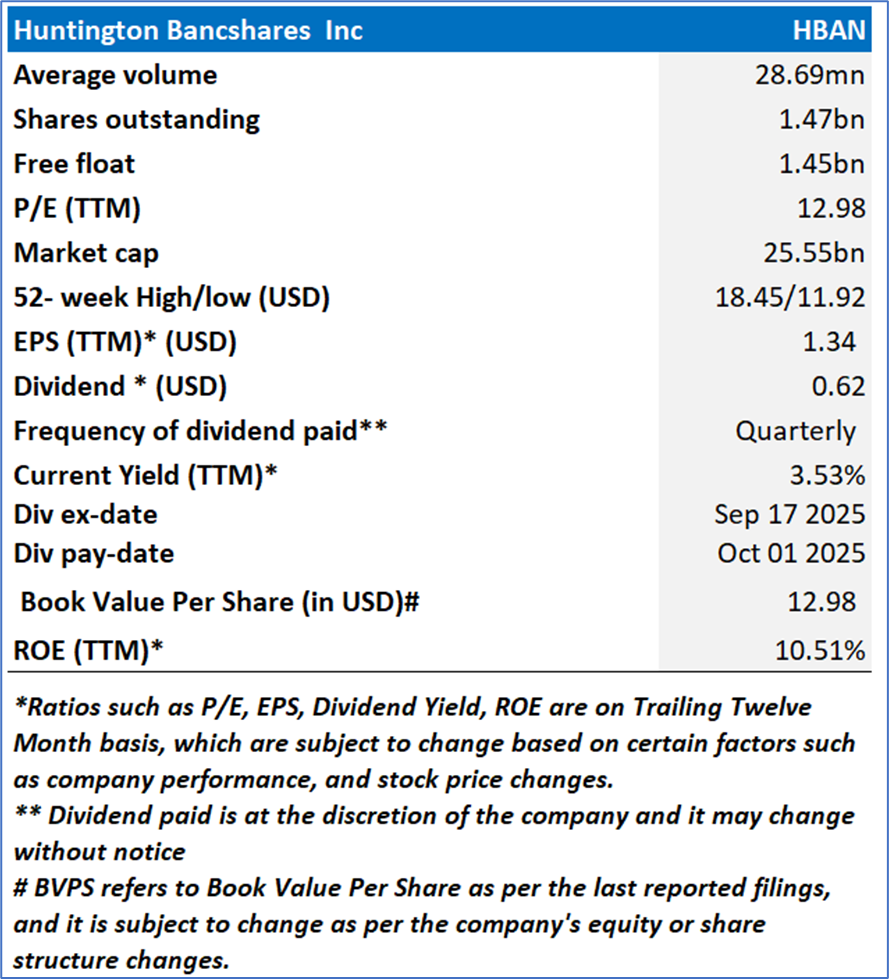
Company Overview:
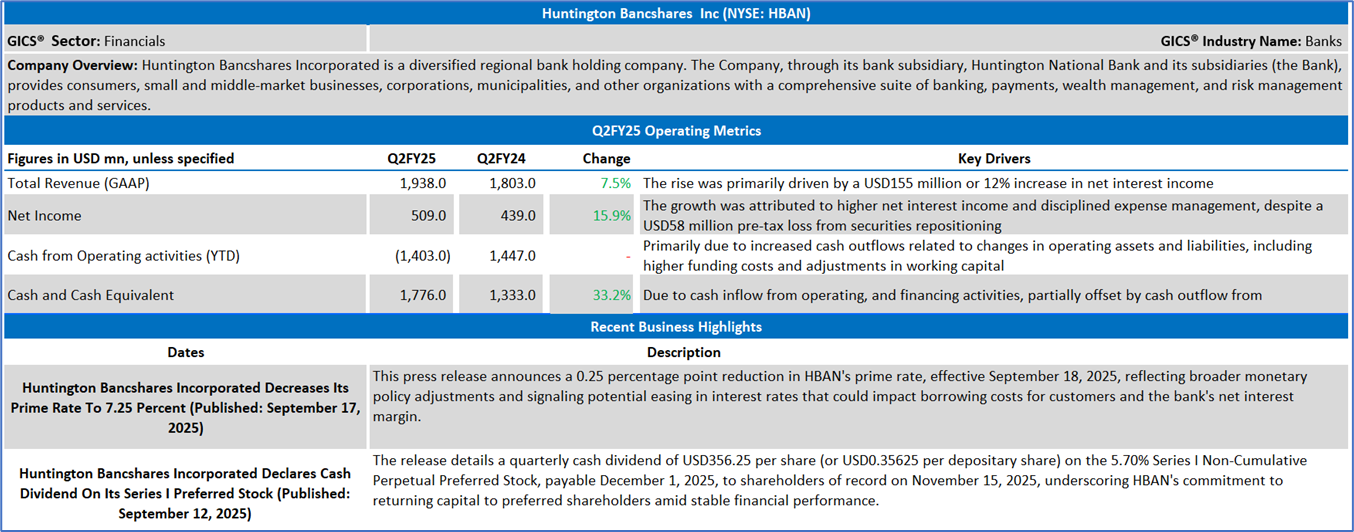
Huntington Bancshares Incorporated (NYSE: HBAN) is a diversified regional bank holding company. The Company, through its bank subsidiary, Huntington National Bank and its subsidiaries (the Bank), provides consumers, small and middle-market businesses, corporations, municipalities, and other organizations with a comprehensive suite of banking, payments, wealth management, and risk management products and services.
This US Inflation Report covers the Company Overview & Price performance, Summary table, Key positives & negatives, Key metrics, Company details, technical guidance & Stock recommendation, and Price chart.
1.2 Summary Table
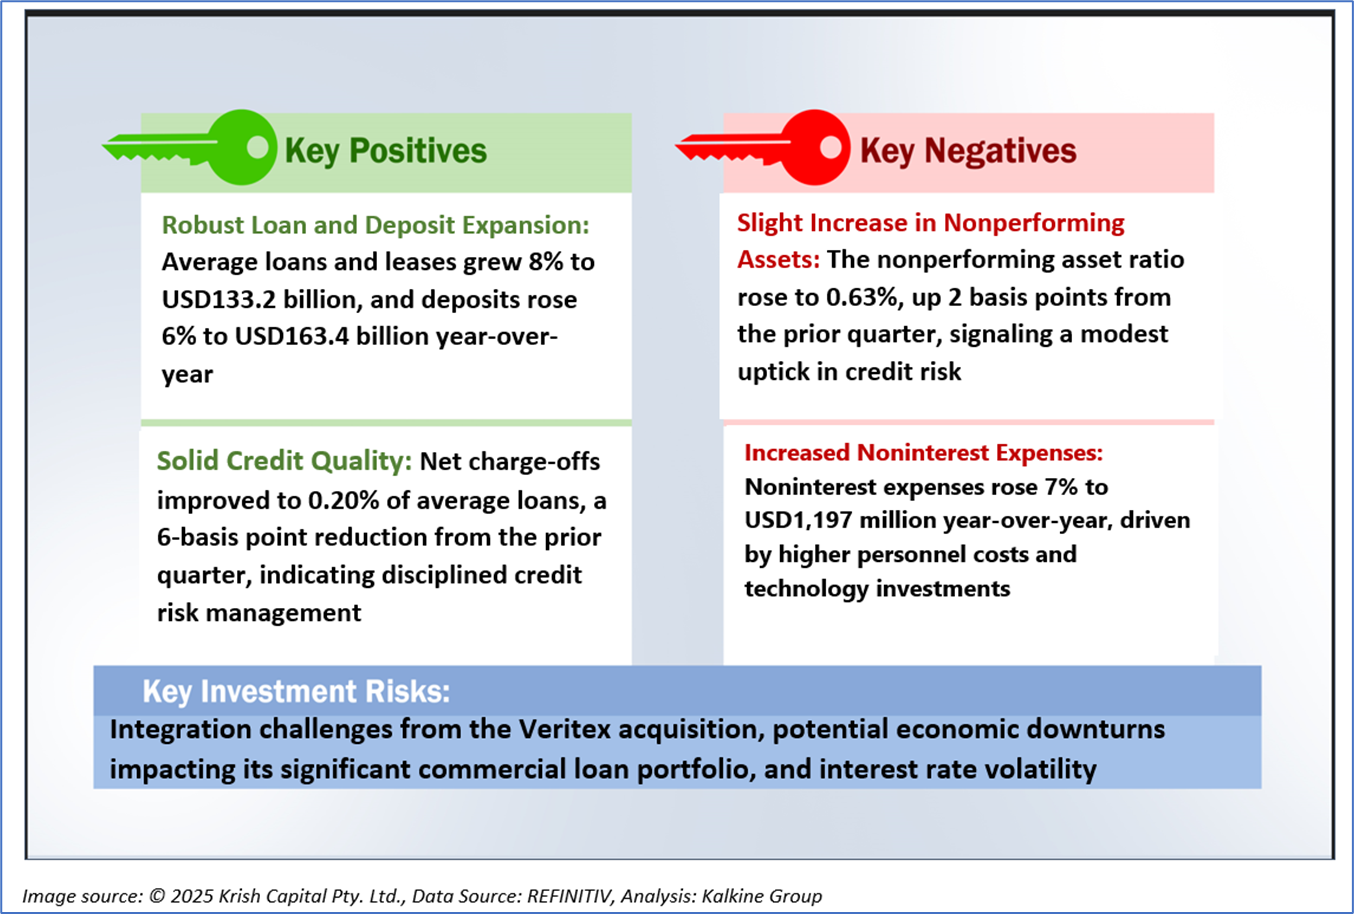
1.3 The Key Positives & Negatives
1.4 Key Metrics
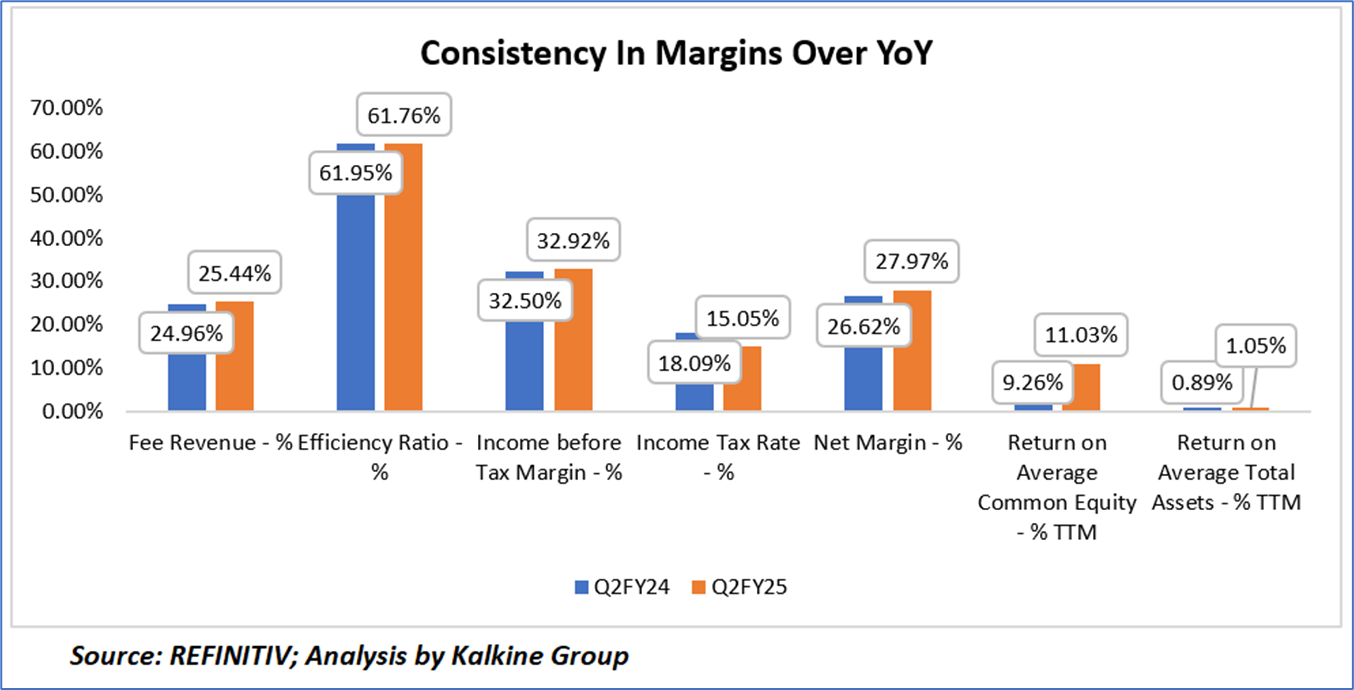
In Q2 2025, Huntington Bancshares Incorporated (HBAN) demonstrated solid financial performance with several key metrics showing improvement over Q2 2024, reflecting effective strategic execution and operational efficiency. The fee revenue ratio increased slightly from 24.96% to 25.44%, indicating a modest enhancement in noninterest income contribution despite a USD58 million securities repositioning loss, driven by a 7% adjusted fee income growth in areas like capital markets and customer fees. The efficiency ratio improved marginally from 61.95% to 61.76%, signaling better cost management even as noninterest expenses rose 7% to USD1,197 million due to higher personnel and technology costs. The income before tax margin rose from 32.50% to 32.92%, supported by a 12% increase in net interest income to USD1,467 million, bolstered by an expanded net interest margin of 3.11%. A lower income tax rate of 15.05% compared to 18.09% further enhanced profitability, contributing to a net margin increase from 26.62% to 27.97%. On a trailing twelve-month basis, the return on average common equity improved significantly from 9.26% to 11.03%, and the return on average total assets rose from 0.89% to 1.05%, underscoring HBAN’s strengthened profitability and efficient capital utilization, though risks from acquisition integration and interest rate volatility warrant careful monitoring.
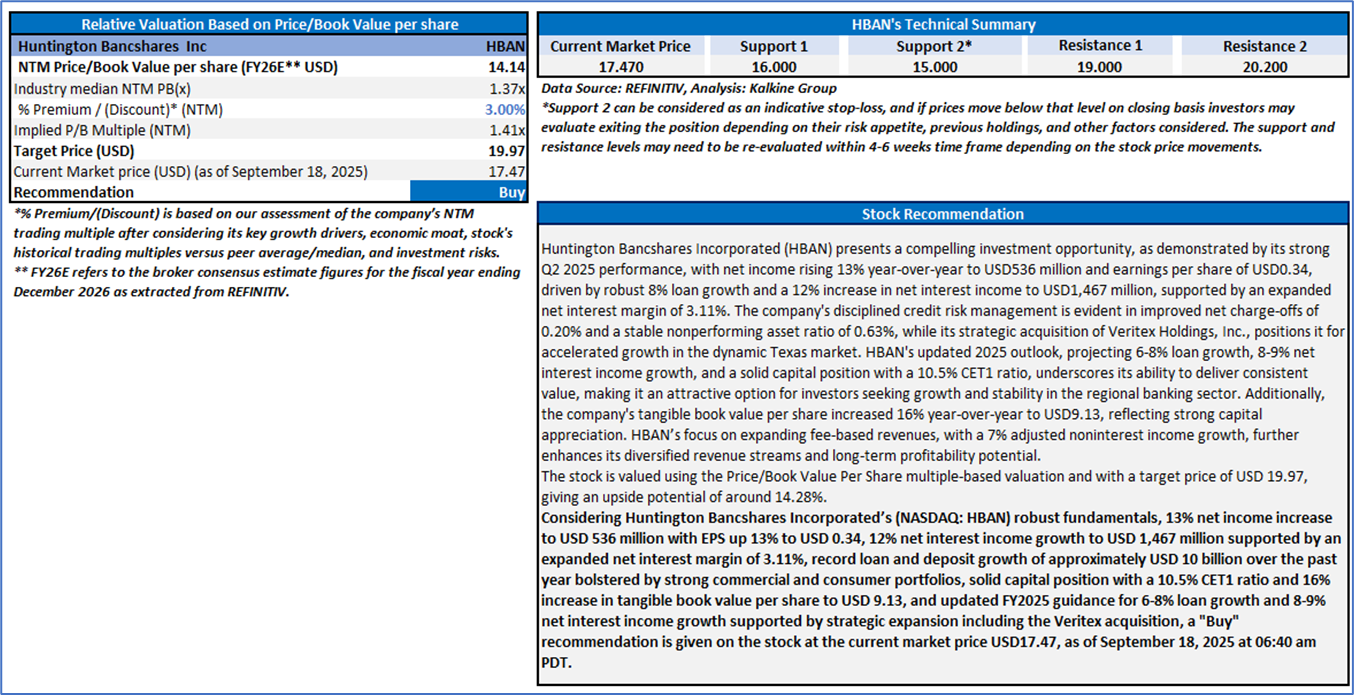
Section 2: Huntington Bancshares Inc (NYSE: HBAN) (“Buy” at the current price of USD17.47, as of September 18, 2025, at 06:40 am PDT)
2.1 Company Details
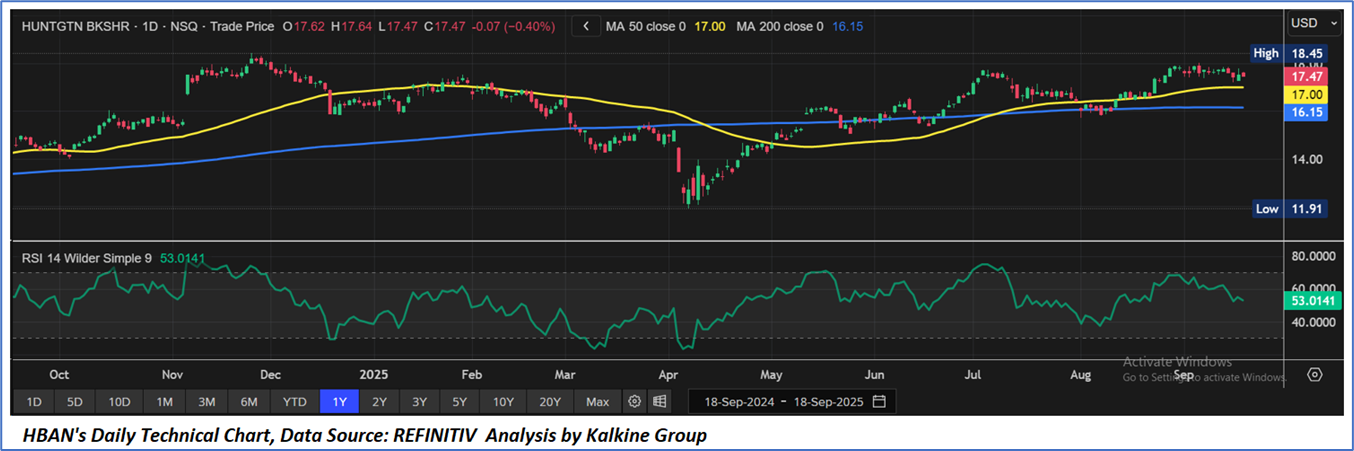
2.2 Technical Guidance and Stock Recommendation
Markets are trading in a highly volatile zone currently due to certain macroeconomic issues and geopolitical tensions prevailing. Therefore, it is prudent to follow a cautious approach while investing.
Note 1: Past performance is not a reliable indicator of future performance.
Note 2: The reference date for all price data, currency, technical indicators, support, and resistance levels is September 18, 2025. The reference data in this report has been partly sourced from REFINITIV.
Note 3: Investment decisions should be made depending on an individual's appetite for upside potential, risks, holding duration, and any previous holdings. An 'Exit' from the stock market can be considered if the Target Price mentioned as per the Valuation and the technical levels provided have been achieved and is subject to the factors discussed above.
Note 4: The report publishing date is as per the Pacific Time Zone.
Technical Indicators Defined: -
Support: A level at which stock prices tend to find support if they fall, and a downtrend may take a pause backed by demand or buying interest. Support 1 refers to the nearby support level for the stock and if the price breaches the level, then Support 2 may act as the crucial support level for the stock.
Resistance: A level at which the stocks prices tend to find resistance when they are rising, and an uptrend may take a pause due to profit booking or selling interest. Resistance 1 refers to the nearby resistance level for the stock and if the price surpasses the level, then Resistance 2 may act as the crucial resistance level for the stock.
Stop-loss: It is a level to protect against further losses in case of unfavorable movement in the stock prices.
Past performance is not a reliable indicator of future performance.
 Please wait processing your request...