Section 1: Company Fundamentals
1.1 Company Overview and Performance summary
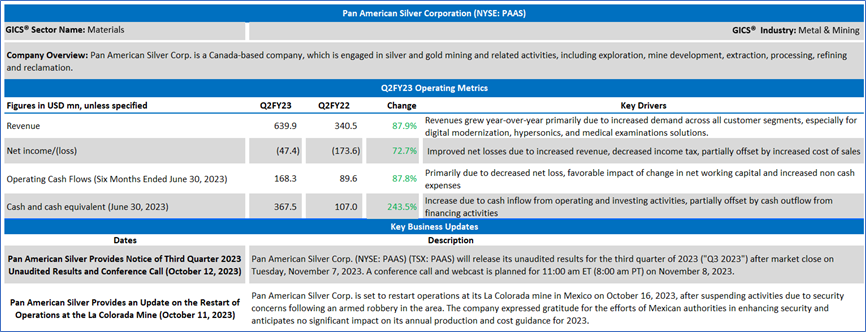
Company Overview:
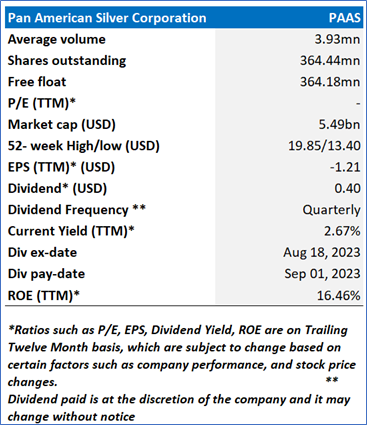
Pan American Silver Corp. (NYSE: PAAS) is a Canada-based company, which is engaged in silver and gold mining and related activities, including exploration, mine development, extraction, processing, refining and reclamation.
This US Inflation Report covers the Company Overview & Price performance, Summary table, Key positives & negatives, Key metrics, Underlying commodities analysis, Company details, technical guidance & Stock recommendation, and Price chart.
Price Performance:
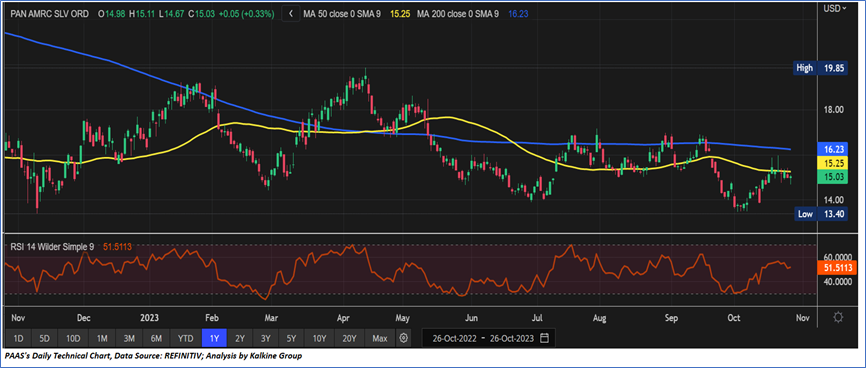
- PAAS's share price has given a return of 4.95% in the past month. Moreover, in the long term, the stock has corrected by 20.05% over the past nine months.
- The stock is currently trading near to the lower end of its 52-week range of USD 85 and 52-week low price of USD 13.40, with the expectations of an upside movement from the current levels.
- The price is currently below its short-term (50-day) SMA and long-term (200-day) SMA, with the current RSI of around 51.51.
1.2 Summary Table
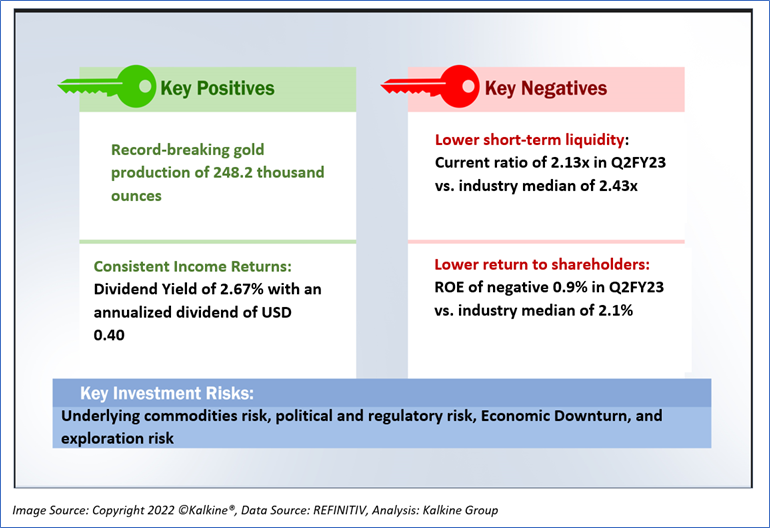
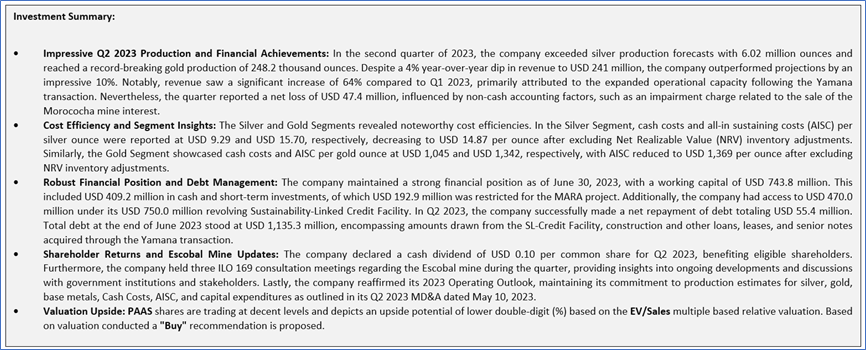
1.3 The Key Positives, Negatives & Investment Summary
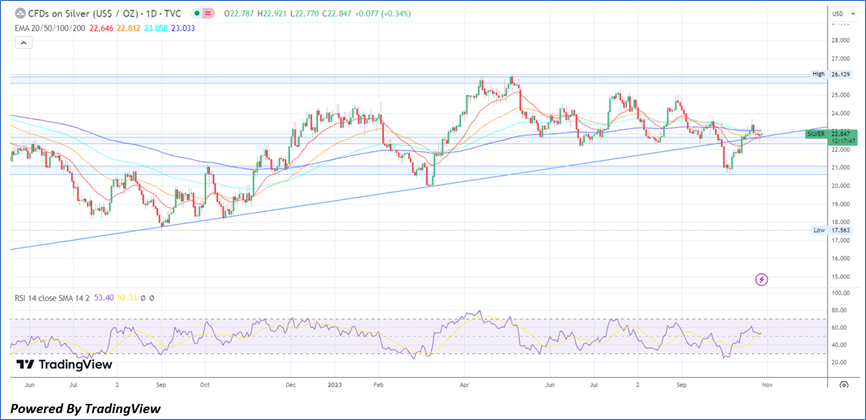
1.4 Underlying Commodity Analysis
Silver prices dipped below the USD23 per ounce mark, declining from a one-month high observed on October 20th. This decrease was attributed to the relative strength of the US dollar, driven by robust economic data in the United States, which raised concerns about potential tightening measures by the Federal Reserve. The allure of holding precious metals, such as silver, was further diminished due to elevated borrowing costs. In contrast, the European Central Bank (ECB) decided to maintain interest rates, signaling the end of its tightening cycle. Silver, often sought after as a safe-haven asset, continued to find support amid the ongoing Middle East conflict. Additionally, optimism regarding increased stimulus measures in China contributed to a positive outlook for silver's industrial applications.
Section 2: Pan American Silver Corp. (NYSE: PAAS) (“Buy” at closing market price of USD 15.03, as of October 26, 2023)
2.1 Company Details
2.2 Valuation and Technical Guidance
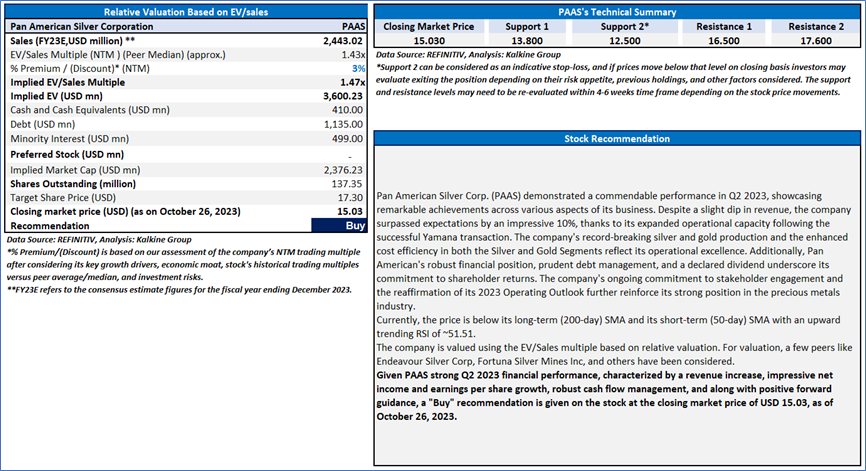
Markets are trading in a highly volatile zone currently due to certain macroeconomic issues and geopolitical tensions prevailing. Therefore, it is prudent to follow a cautious approach while investing.
Note 1: Past performance is not a reliable indicator of future performance.
Note 2: The reference date for all price data, currency, technical indicators, support, and resistance levels is October 26, 2023. The reference data in this report has been partly sourced from REFINITIV.
Note 3: Investment decisions should be made depending on an individual's appetite for upside potential, risks, holding duration, and any previous holdings. An 'Exit' from the stock can be considered if the Target Price mentioned as per the Valuation and or the technical levels provided has been achieved and is subject to the factors discussed above.
Note 4: The report publishing date is as per the Pacific Time Zone.
Technical Indicators Defined: -
Support: A level at which the stock prices tend to find support if they are falling, and a downtrend may take a pause backed by demand or buying interest. Support 1 refers to the nearby support level for the stock and if the price breaches the level, then Support 2 may act as the crucial support level for the stock.
Resistance: A level at which the stock prices tend to find resistance when they are rising, and an uptrend may take a pause due to profit booking or selling interest. Resistance 1 refers to the nearby resistance level for the stock and if the price surpasses the level, then Resistance 2 may act as the crucial resistance level for the stock.
Stop-loss: It is a level to protect against further losses in case of unfavorable movement in the stock prices.
Disclaimer
The advice given by Kalkine Canada Advisory Services Inc. and provided on this website is general information only and it does not take into account your investment objectives, financial situation and the particular needs of any particular person. You should therefore consider whether the advice is appropriate to your investment objectives, financial situation and needs before acting upon it. You should seek advice from a financial adviser, stockbroker or other professional (including taxation and legal advice) as necessary before acting on any advice. Not all investments are appropriate for all people. The website www.kalkine.ca is published by Kalkine Canada Advisory Services Inc. The link to our Terms & Conditions has been provided please go through them. On the date of publishing this report (mentioned on the website), employees and/or associates of Kalkine do not hold positions in any of the stocks covered on the website. These stocks can change any time and readers of the reports should not consider these stocks as advice or recommendations later.
Past performance is not a reliable indicator of future performance.
 Please wait processing your request...