Section 1: Company Fundamentals
1.1 Company Overview and Performance summary
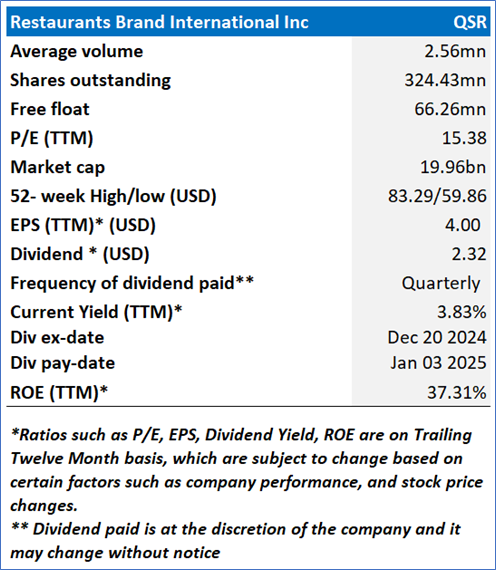
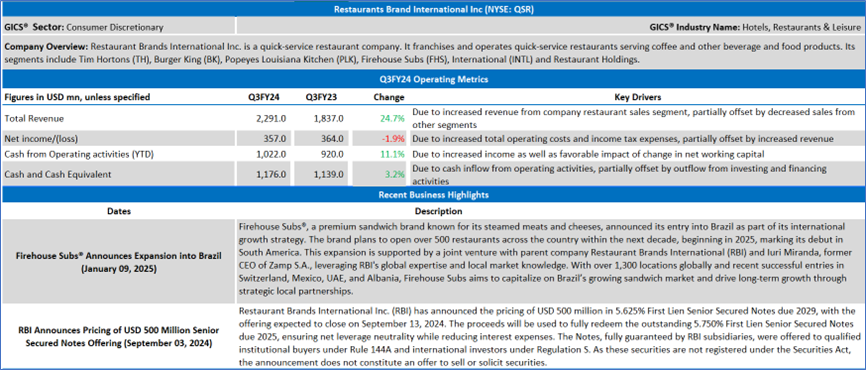
Company Overview:
Restaurant Brands International Inc. (NYSE: QSR) is a quick-service restaurant company. It franchises and operates quick-service restaurants serving coffee and other beverage and food products. Its segments include Tim Hortons (TH), Burger King (BK), Popeyes Louisiana Kitchen (PLK), Firehouse Subs (FHS), International (INTL) and Restaurant Holdings.
This US Inflation Report covers the Company Overview & Price performance, Summary table, Key positives & negatives, Key metrics, Company details, technical guidance & Stock recommendation, and Price chart.
Price Performance:
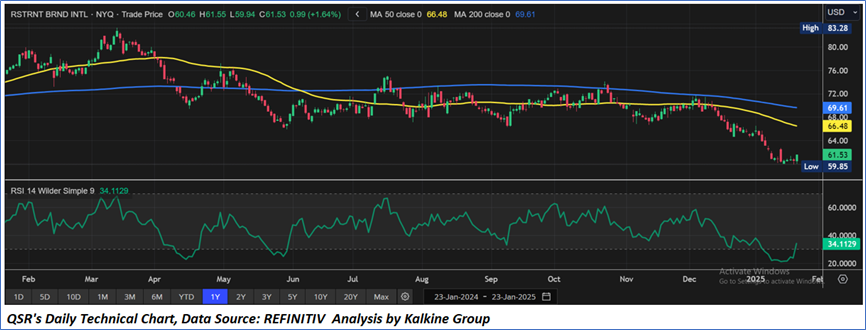
- QSR's share price has fallen by 14.76% in the past three months. Similarly, in the long term, the stock has fallen by 19.19% over the past year.
- The stock is currently trading near to the lower end of its 52-week range of USD 83.29 and 52-week low price of USD 59.86, with the expectations of an upside movement in case the USD 60.00 support holds.
- The price is currently below both its short-term (50-day) SMA and long-term (200-day) SMA, with the current RSI of around 34.11.
1.2 Summary Table
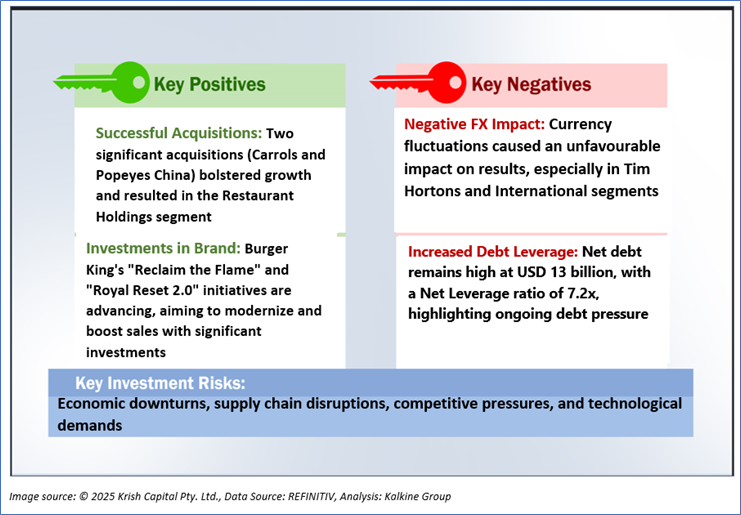
1.3 The Key Positives & Negatives
1.4 Key Metrics
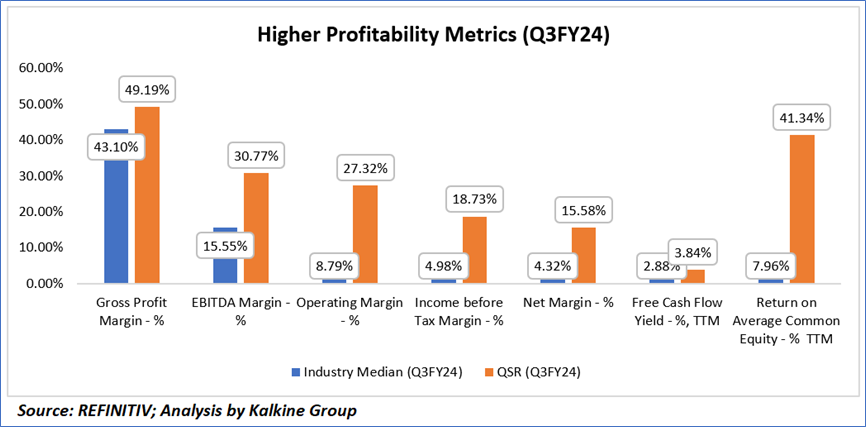
In Q3FY24, the Quick Service Restaurant (QSR) industry demonstrated superior financial performance compared to the industry median across several key metrics. The gross profit margin of QSR stood at 49.19%, notably higher than the industry median of 43.10%, indicating better cost efficiency and product pricing strategies. The EBITDA margin for QSR at 30.77% was more than double the median of 15.55%, reflecting strong operational efficiency and profitability. Similarly, the operating margin of 27.32% for QSR significantly outpaced the industry median of 8.79%, further demonstrating its effective cost management and profitability at the operating level. The income before tax margin for QSR was 18.73%, compared to the industry median of 4.98%, signaling stronger pre-tax earnings relative to revenue. This trend continued with QSR’s net margin of 15.58%, which was more than three times higher than the median of 4.32%. In terms of cash flow, QSR’s free cash flow yield of 3.84% exceeded the median of 2.88%, indicating a healthier ability to generate cash relative to its market value. Lastly, QSR's return on average common equity (ROE) of 41.34% sharply outperformed the industry median of 7.96%, showcasing a highly efficient use of shareholders' equity to generate profit. Overall, QSR exhibits stronger financial health and operational efficiency relative to its industry peers.
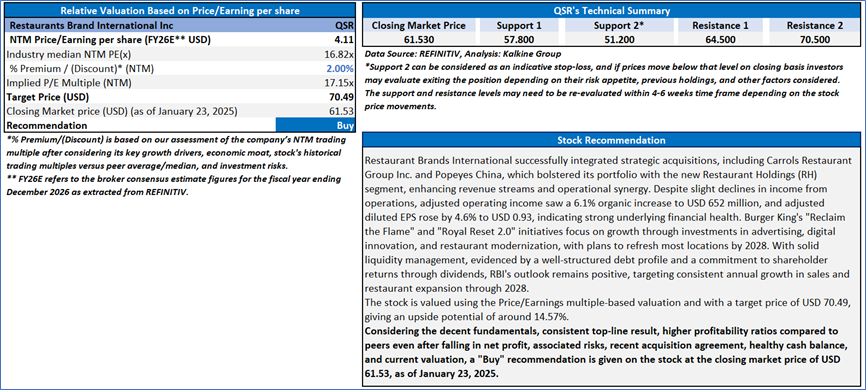
Section 2: Restaurants Brand International Inc (NYSE: QSR) (“Buy” at the closing price of 61.53, as of January 23, 2025)
2.1 Company Details
2.2 Technical Guidance and Stock Recommendation
Markets are trading in a highly volatile zone currently due to certain macroeconomic issues and geopolitical tensions prevailing. Therefore, it is prudent to follow a cautious approach while investing.
Note 1: Past performance is not a reliable indicator of future performance.
Note 2: The reference date for all price data, currency, technical indicators, support, and resistance levels is January 23, 2025. The reference data in this report has been partly sourced from REFINITIV.
Note 3: Investment decisions should be made depending on an individual's appetite for upside potential, risks, holding duration, and any previous holdings. An 'Exit' from the stock can be considered if the Target Price mentioned as per the Valuation and or the technical levels provided has been achieved and is subject to the factors discussed above.
Note 4: The report publishing date is as per the Pacific Time Zone.
Technical Indicators Defined: -
Support: A level at which the stock prices tend to find support if they are falling, and a downtrend may take a pause backed by demand or buying interest. Support 1 refers to the nearby support level for the stock and if the price breaches the level, then Support 2 may act as the crucial support level for the stock.
Resistance: A level at which the stocks prices tend to find resistance when they are rising, and an uptrend may take a pause due to profit booking or selling interest. Resistance 1 refers to the nearby resistance level for the stock and if the price surpasses the level, then Resistance 2 may act as the crucial resistance level for the stock.
Stop-loss: It is a level to protect against further losses in case of unfavorable movement in the stock prices.
Past performance is not a reliable indicator of future performance.
 Please wait processing your request...