Section 1: Company Fundamentals
1.1 Company Overview and Performance summary
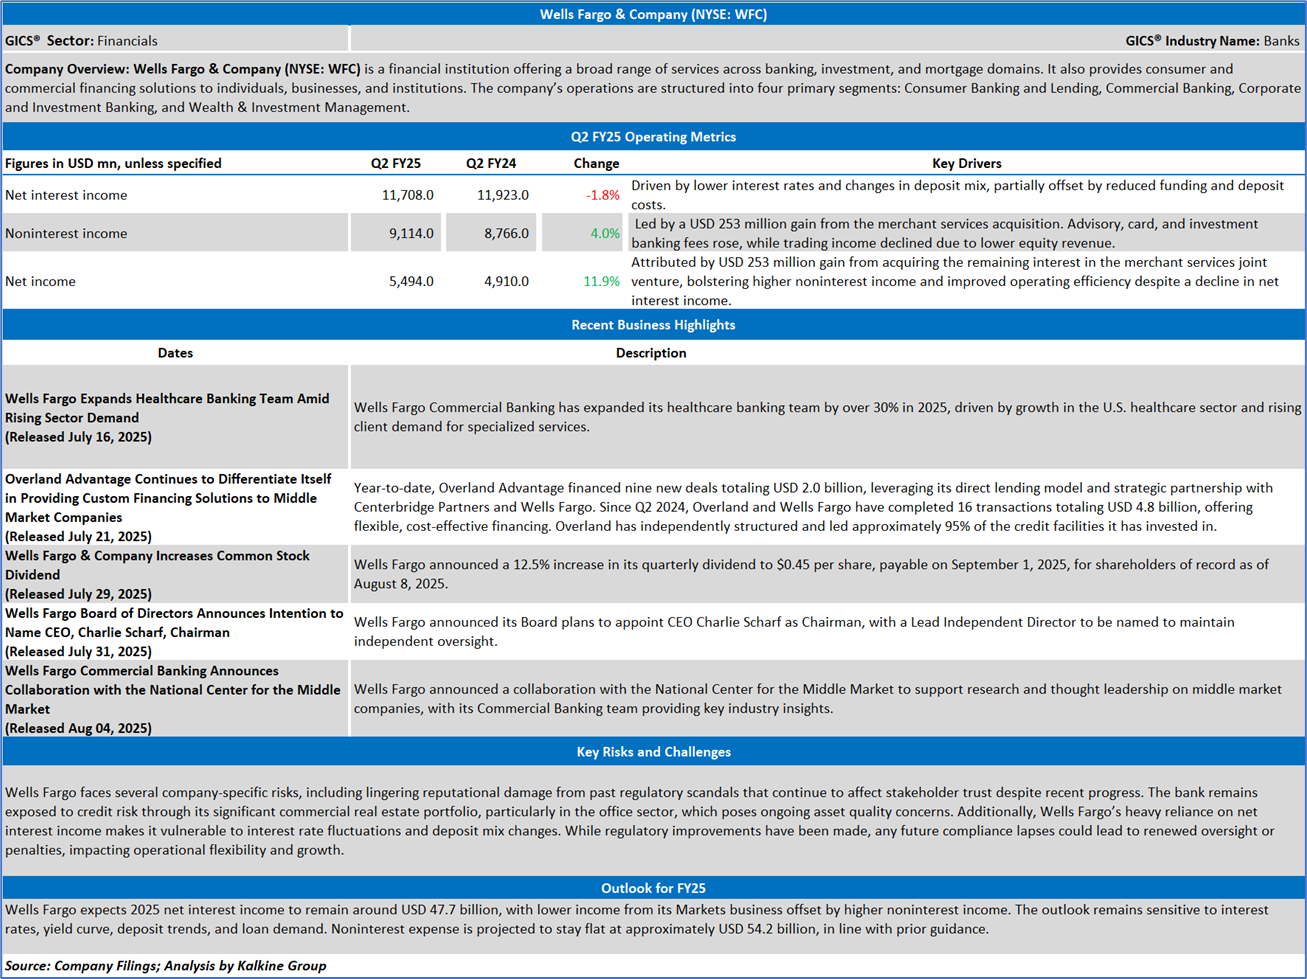
Company Overview:
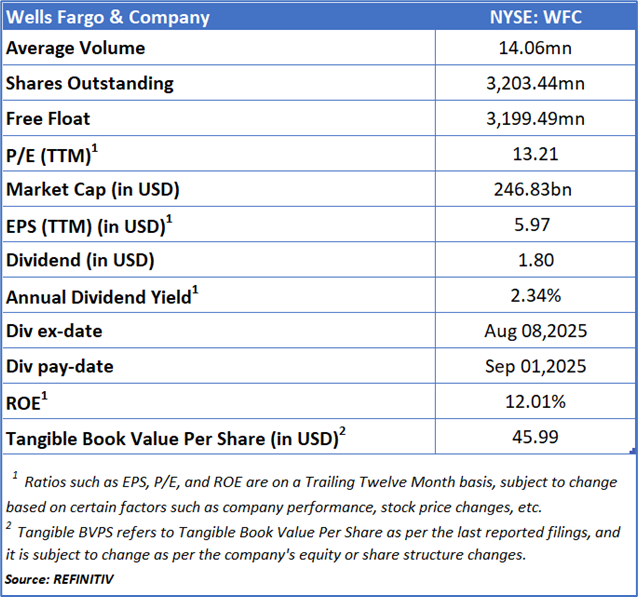
Wells Fargo & Company (NYSE: WFC) is a financial institution offering a broad range of services across banking, investment, and mortgage domains. It also provides consumer and commercial financing solutions to individuals, businesses, and institutions. The company’s operations are structured into four primary segments: Consumer Banking and Lending, Commercial Banking, Corporate and Investment Banking, and Wealth & Investment Management.
This US Inflation Report covers the Company Overview & Price performance, Summary table, Key positives & negatives, Key metrics, Company details, technical guidance & Stock recommendation, and Price chart.
Price Performance:
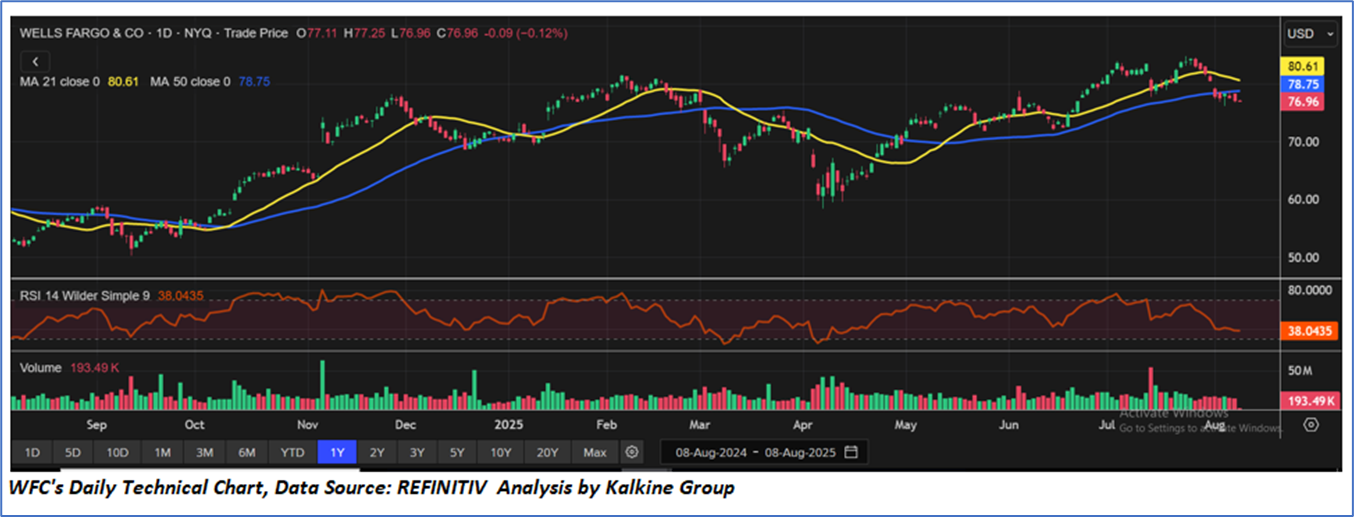
- The 21-day moving average (MA) is currently at USD 80.61, and the 50-day MA is at USD 78.75. The stock price is trading below both moving averages at USD 76.96.
- While the stock has recently pulled back to USD 76.96, it is still within a long-term uptrend that began in late 2023. The price action remains relatively resilient despite market volatility.
- The RSI stands at 38.04, which is nearing the oversold threshold (30) — a zone that often precedes technical rebounds or trend reversals.
1.2 Summary Table
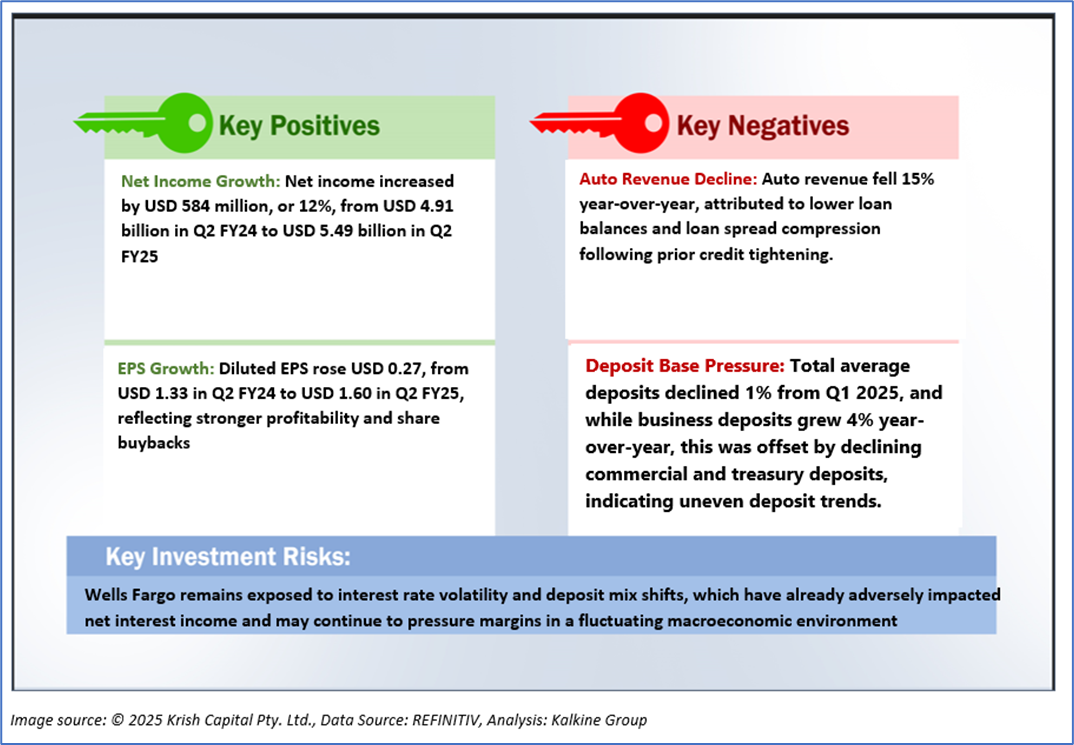
1.3 The Key Positives & Negatives
1.4 Key Metrics
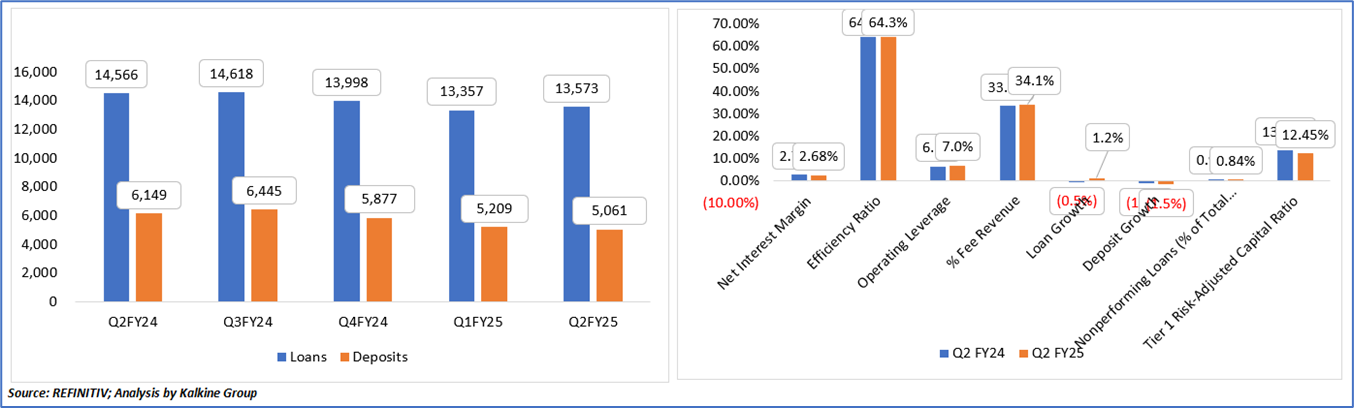
Net interest margin slightly declined due to lower interest rates and changes in deposit mix, while the efficiency ratio remained stable at 64% owing to effective cost controls and productivity initiatives. Operating leverage improved marginally, supported by higher fee-based revenue, which rose from 33% to 34.1% of total revenue. Loan growth remained nearly flat, reflecting cautious lending amid weaker demand, while deposits declined by 1.5% due to strategic runoff of higher-cost deposits. Nonperforming loans as a percentage of total loans improved, indicating healthier credit quality. The Tier 1 capital ratio increased to 12.45%, reflecting a strengthened capital base through retained earnings and share repurchases.
Moreover, Loans volume fell from USD 14,566 million to USD 13,573 million, driven by lower balances in home, auto, and personal lending, along with tighter underwriting standards. However, the small uptick in Q2 FY25 signals early signs of stabilization. Deposits saw a more significant drop, from USD 6,149 million to USD 5,061 million, due to deliberate reductions in high-cost corporate treasury CDs and rate-sensitive outflows. This reflects Wells Fargo’s strategy to optimize funding sources and improve deposit cost efficiency amid a changing interest rate environment.
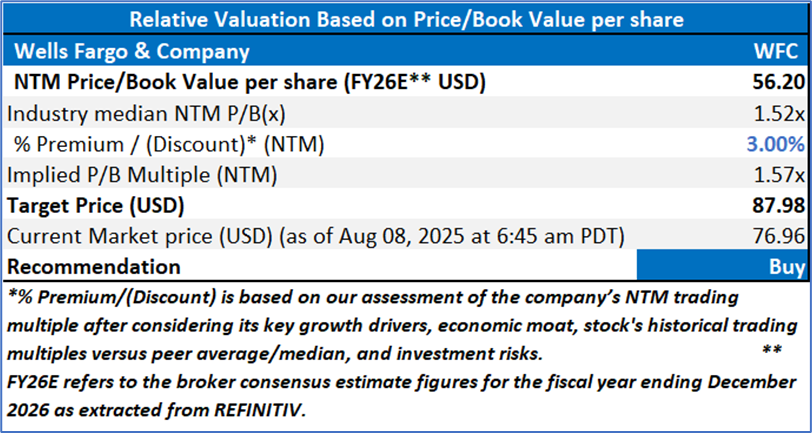
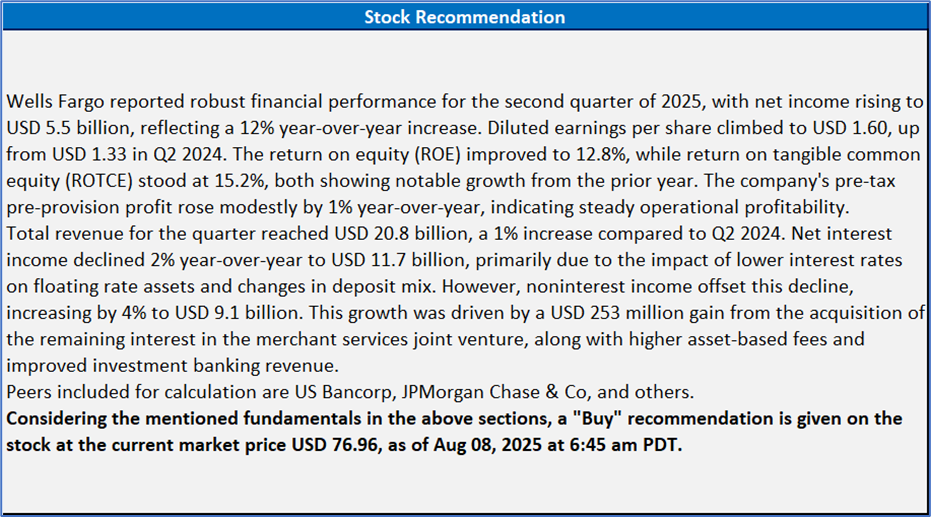
Section 2: Wells Fargo & Company (NYSE: WFC) (“Buy” at the current market price of USD 76.96, as of August 08,2025 at 6:45 am PDT)
2.1 Company Details
2.2 Technical Guidance and Stock Recommendation
Markets are trading in a highly volatile zone currently due to certain macroeconomic issues and geopolitical tensions prevailing. Therefore, it is prudent to follow a cautious approach while investing.
Note 1: Past performance is not a reliable indicator of future performance.
Note 2: The reference date for all price data, currency, technical indicators, support, and resistance levels is Aug 08, 2025. The reference data in this report has been partly sourced from REFINITIV.
Note 3: Investment decisions should be made depending on an individual's appetite for upside potential, risks, holding duration, and any previous holdings. An 'Exit' from the stock can be considered if the Target Price mentioned as per the Valuation and or the technical levels provided has been achieved and is subject to the factors discussed above.
Note 4: The report publishing date is as per the Pacific Time Zone.
Technical Indicators Defined: -
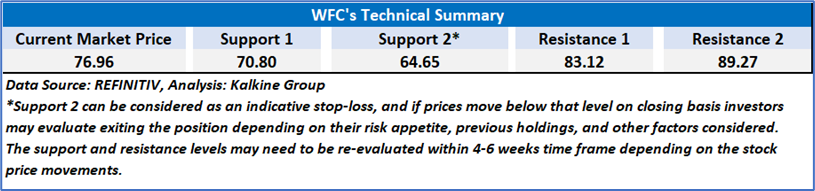
Support: A level at which the stock prices tend to find support if they are falling, and a downtrend may take a pause backed by demand or buying interest. Support 1 refers to the nearby support level for the stock and if the price breaches the level, then Support 2 may act as the crucial support level for the stock.
Resistance: A level at which the stocks prices tend to find resistance when they are rising, and an uptrend may take a pause due to profit booking or selling interest. Resistance 1 refers to the nearby resistance level for the stock and if the price surpasses the level, then Resistance 2 may act as the crucial resistance level for the stock.
Stop-loss: It is a level to protect against further losses in case of unfavorable movement in the stock prices.
Past performance is not a reliable indicator of future performance.
 Please wait processing your request...